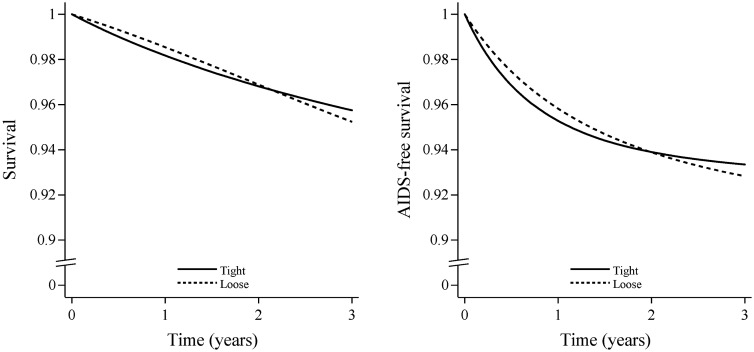
Figure 2.
Survival (left) and AIDS-free survival (right) under tight- and loose-control switching strategies in the ART-CC, the CNICS and the HIV-CAUSAL Collaboration, 2002–12. The curves are standardized by the baseline covariates and inverse-probability weighted by the time-varying covariates listed under Table 4.

