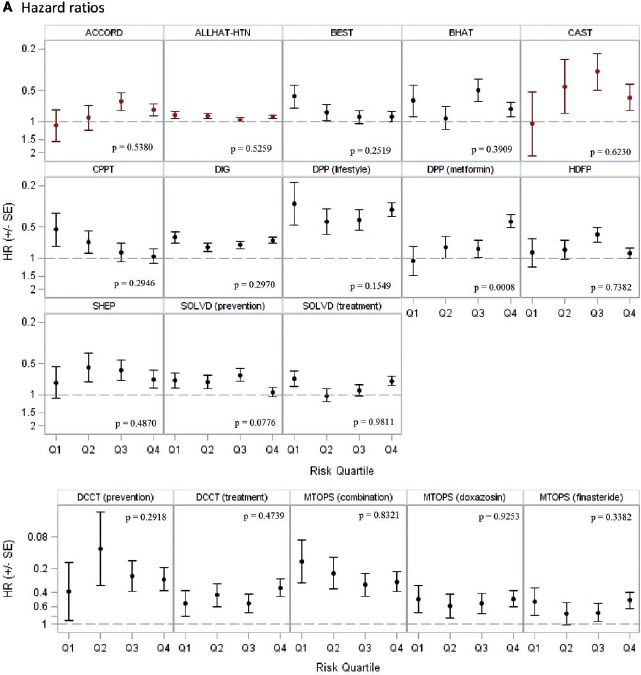
Figure 2.

A: Hazard or odds ratios across risk quartiles Hazard ratios are shown for all trials except HDFP, which displays odds ratios. Red markers indicate that the treatment arms were switched (intervention was harmful). The scale for hazard ratio axis is different for DCCT and MTOPS.
