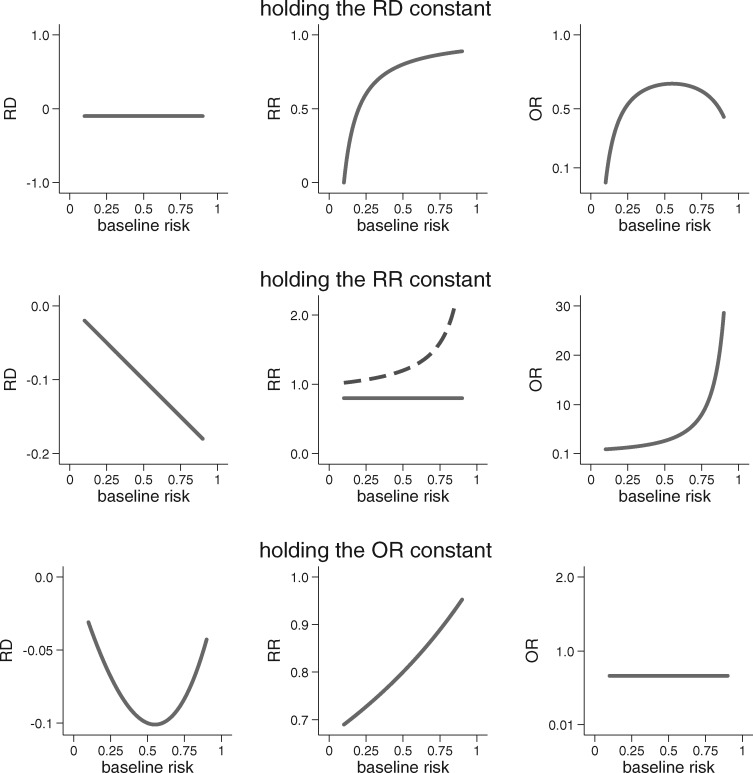
Figure 1.
An illustration of the scale dependence of HTE. When treatment effect is non-null and baseline risk varies, HTE is inevitable on at least two out of three of the most commonly used scales for treatment effect. The graphs above show that when one measure of treatment effect is held constant, the other two must vary substantially as the baseline risk changes. The centre panel also demonstrates that when the treatment effect is non-null and baseline risk varies, when the RR is held constant for ‘event occurrence’, then there will exist HTE for the complementary outcome (i.e. ‘no event occurrence’, shown by the dotted line). When held constant, the RD = −0.1, the RR = 0.8 and the OR = 0.66. Results are shown over baseline outcome risks ranging from 0.1 to 0.9.

