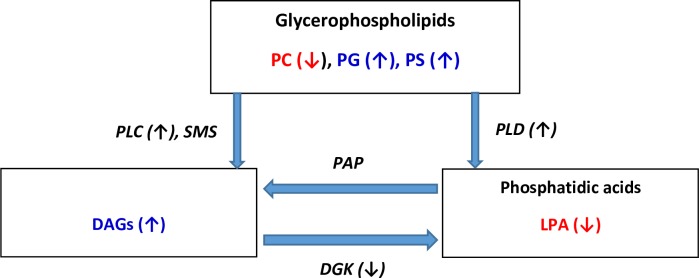
Fig 6. Abbreviated schematic presentation of DAG metabolism.
LPA, lysophosphatidic acid; PC, phosphatidylcholine; PG, phosphatidylglycerol; PS, phosphatidylserine; PLC, phospholipase C; PLD, phospholipase D; SMS, sphingomyelin synthase; DGK, diacylglycerol kinase. Red indicates lowered levels and blue indicates increased levels observed in our study.

