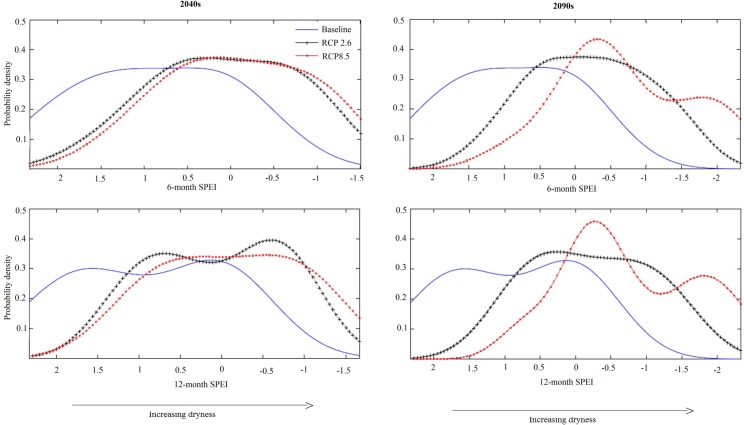
Fig 7. Probability density plots of 6-month and 12-month Standardized Streamflow Index (SSI) derived under baseline climatic conditions and under RCP scenarios.
SSI values < 0 represent streamflow drought and the greater the absolute value, the higher the severity. SSI values > 0 represent higher streamflow.

