Figure 5.
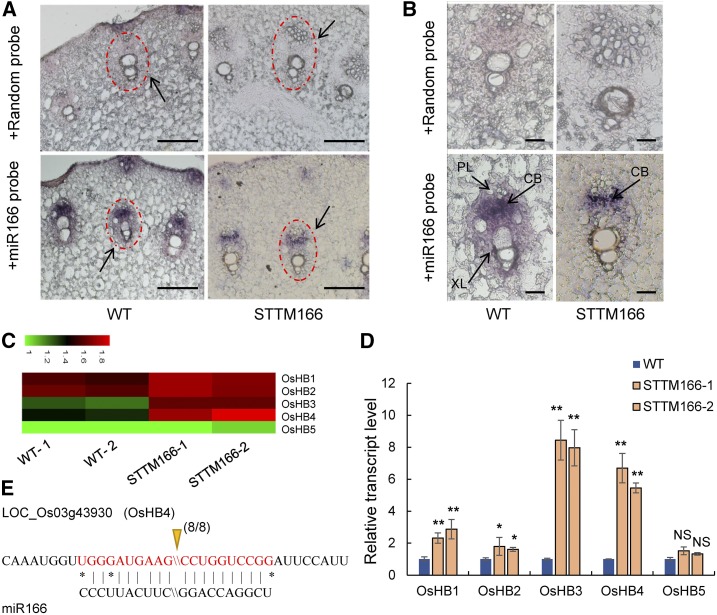
In situ hybridization of miR166 and the expression profiles of OsHB genes. A, In situ hybridization of miR166 in stem of STTM166-1 and wild-type plants. Scale bar, 200 μm. Black arrow indicates vascular bundle. B, Magnified images of vascular bundles after in situ hybridization. Scale bar, 20 μm. XL, Xylem; PL, phloem; CB, cambium. C, The heat map of expression patterns of OsHB genes from the RNA-seq data. D, The expression profiles of OsHB genes in STTM166 and wild-type plants. E, The cleavage site of OsHB4 mRNAs mediated by miR166. Solid arrow indicates the frequency of RACE clones corresponding to the site. Data are presented as means ± sd (n = 3 in D). **P < 0.01, two-tailed, two-sample Student’s t test.

