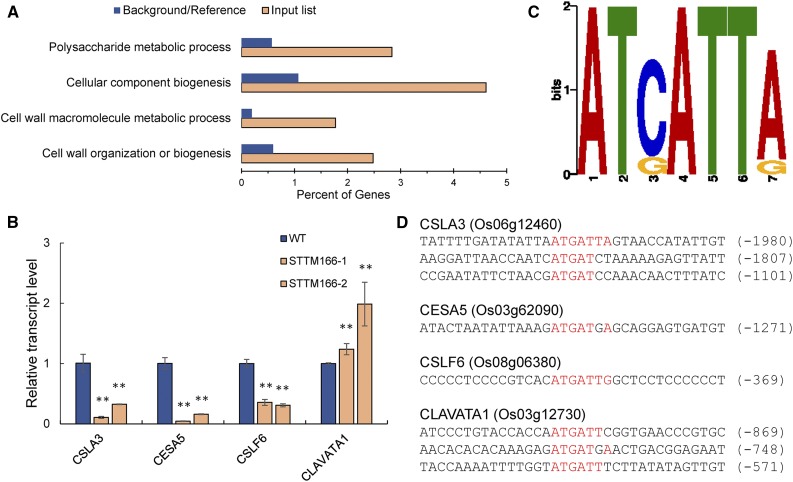
Figure 7.
Differentially expressed genes in STTM166 lines. A, Enrichment of selected Gene Ontology (GO) categories of differentially expressed genes by RNA-seq analysis. Plotted is the percentage of genes (x axis) identified in the differentially expressed genes by RNA-seq analysis (diagonal bars) in comparison with the abundance in the whole transcriptome (black bars) for three significantly enriched GO categories. B, The expression patterns of the polysaccharide synthesis-related genes. CSLA3, Cellulose Synthase-like Protein A3, probably for mannan synthesis leading to the formation of noncellulosic polysaccharides of plant cell wall; CESA5, Cellulose Synthase A Catalytic Subunit5, a probable cellulose synthesis enzyme; CSLF6, Cellulose Synthase-like Protein F6, probably for synthesis of mixed-linked glucan; CLAVATA1, receptor protein kinase CLAVATA1. C, DNA sequence representing the predicted core of the in vitro HD-ZIP III binding site. D, The putative binding site (red-colored) of HD-ZIP III transcription factors in the genes related to cell wall organization and biogenesis. The numbers in brackets indicate the distance to the ATG start codon. Data are presented as means ± sd (n = 3 in B). **P < 0.01, two-tailed, two-sample Student’s t test.

