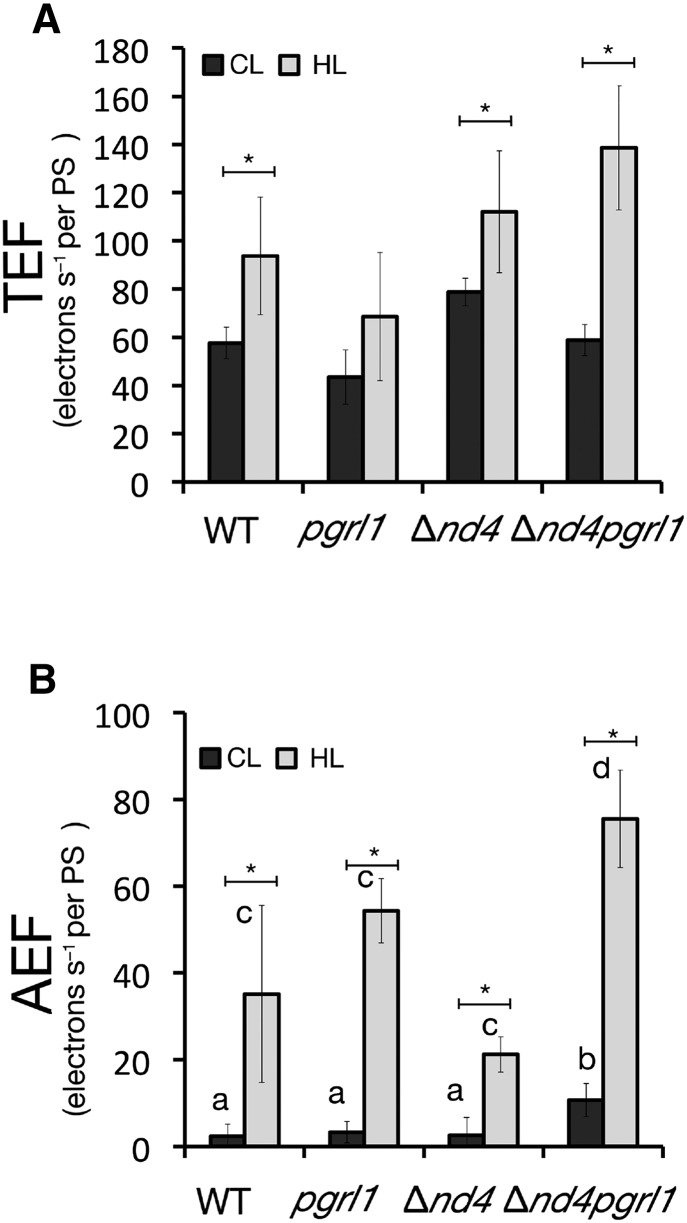
Figure 3.
Photosynthetic electron transport rate of the wild type, Δnd4, pgrl1, and Δnd4pgrl1. TEF (A) and AEF (B) electron transport rates evaluated from ECS relaxation kinetics. Rates are normalized to the total PSI and PSII amount quantified using a saturating flash. Data refer to the rates measured in wild-type, pgrl1, Δnd4, and Δnd4pgrl1 strains grown photoautotrophically in CL (n = 6 ± sd) and in HL condition (n = 4 ± sd). Asterisks indicate statistically significant differences between the same genotype in CL and HL conditions. Different letters instead indicate statistically significant differences between genotypes in the same light conditions (ANOVA, P value < 0.05).

