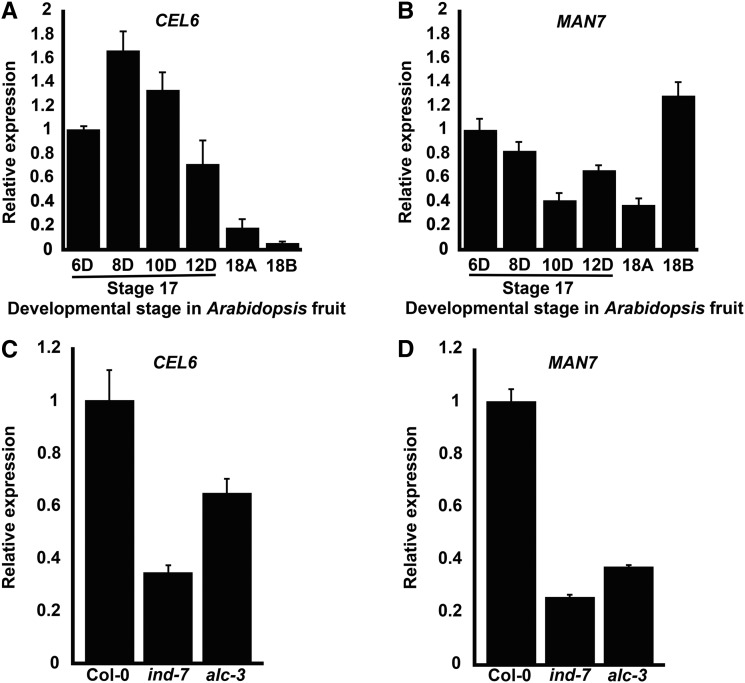
Figure 1.
RT-qPCR analysis of CEL6 and MAN7 expression in siliques of Col-0 and the ind-7 and alc-3 mutants. A, CEL6 expression at different developmental stages of Col-0. B, MAN7 expression at different developmental stages of Col-0. C, CEL6 expression at stage 17B in Col-0 and the ind-7 and alc-3 mutant. D, MAN7 expression at stage 17B in Col-0 and the ind-7 and alc-3 mutant. 6D-12D in A and B and similar designations in subsequent figures denote the number of days after anthesis. Shown in each plot are average relative expression levels ± se with the value of the first bar on the left being 1.

