Figure 3.
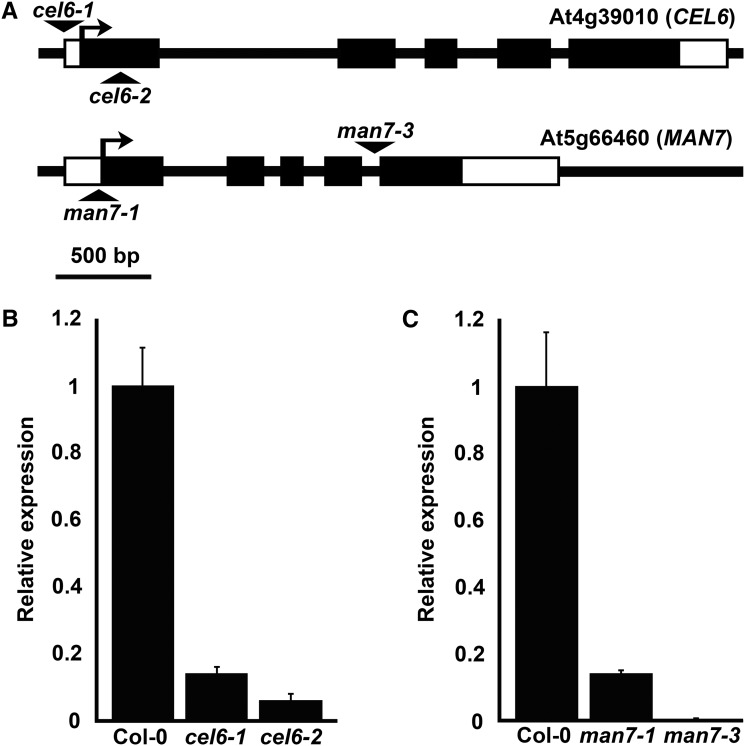
Identification of the cel6-1, cel6-2, man7-1, and man7-3 mutants. A, Positions of the T-DNA insertions in At4g39010 (CEL6) and At5g66460 (MAN7). Black boxes and the lines between them represent exons and introns, respectively. Open boxes represent the predicted 5′- and 3′-untranslated regions. Triangles indicate the positions of the T-DNA insertions. B, Average relative expression levels (±se) of CEL6 in stage-17 siliques of Col-0 and the cel6-1 and cel6-2 mutants. The Col-0 expression level is defined as 1. C, Average relative expression levels (±se) of MAN7 in stage-17 siliques of Col-0 and the man7-1 and man7-3 mutants. The Col-0 expression level is defined as 1.

