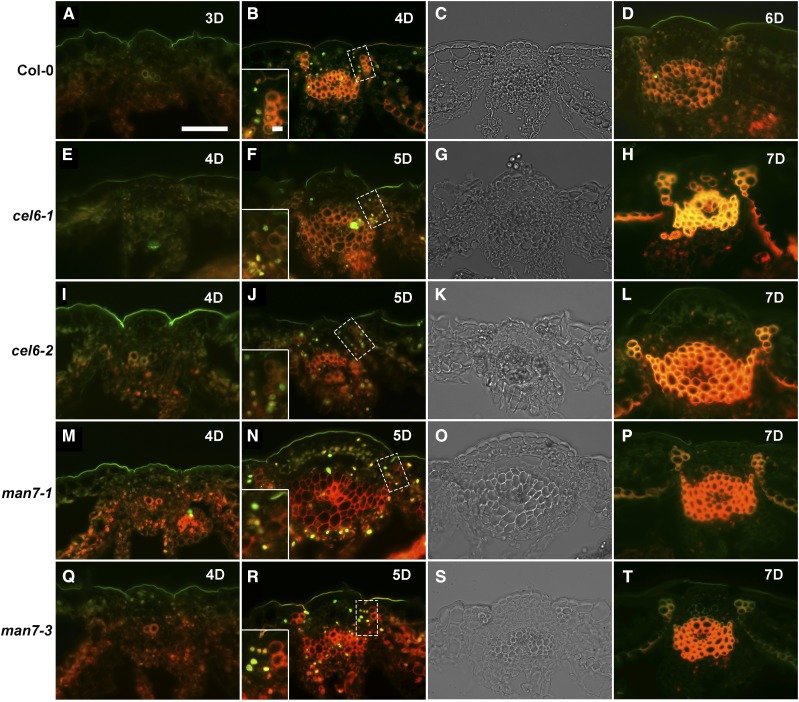
Figure 5.
TUNEL signals in silique cross sections of Col-0 and the cel6-1, cel6-2, man7-1, and man7-3 mutants. All images are merged TUNEL (green) and PI (red; nuclear stain) fluorescence images, except for C, G, K, O, and S, which are bright-field images corresponding to images immediately to the left, respectively. Insets show enlargements of the rectangular areas marked in the corresponding images. Bar in the inset in B = 5 µm for all the insets, and bar in A = 50 μm all the other images.

