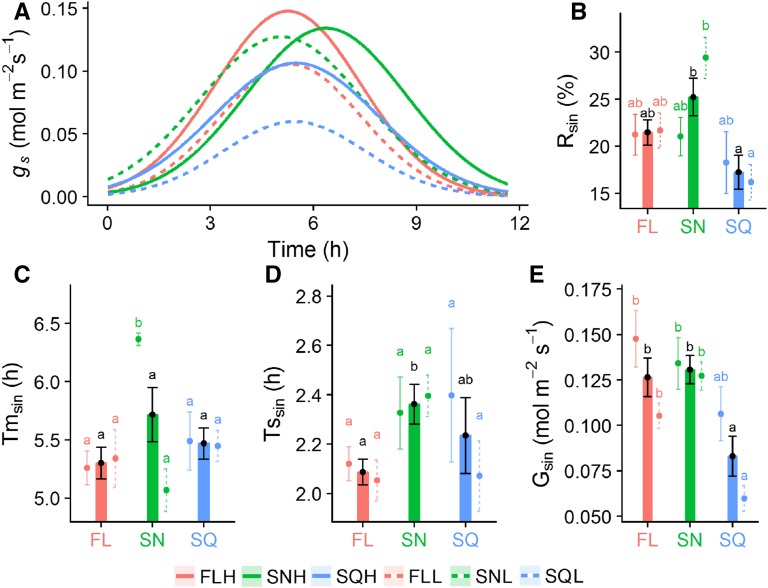
Figure 2.
Quantification of the Gaussian signal of gs during diurnal measurements. Diurnal gs measured under square wave light (A); the relative percentage of Gaussian driven gs (Rsin, B); the time at which peak gs occurs (Tmsin, C); the width of the peak (Tssin, D); and the magnitude of the Gaussian gs response (Gsin, E). FLH (red), SNH (green), and SQH (blue) high-light treatments (full lines) were measured under SQHigh. FLL (red), SNL (green), and SQL (blue) low-light treatments (dashed lines) were measured under SQLow. Bars are combined data from high and low-light treatments. Error bars represent mean ± se, n = 5–7. Colored letters represent the results of Tukey’s posthoc comparisons of group means from the individual light treatments, and black letters are the result from combined high- and low-light treatments.

