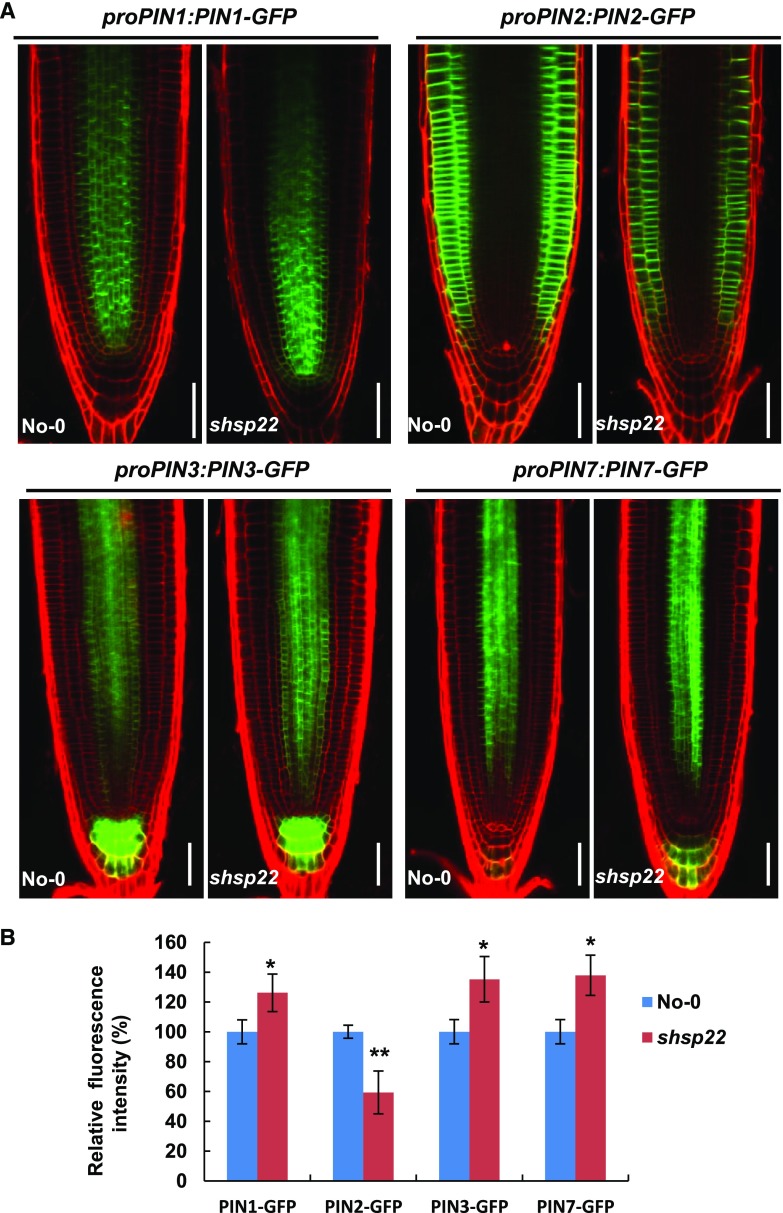
Figure 10.
The distribution of PIN proteins in shsp22. A, Distribution of proPIN1:PIN1-GFP, proPIN2:PIN2-GFP, proPIN3:PIN3-GFP, and proPIN7:PIN7-GFP in the roots of No-0 and shsp22 4 d after germination. PI was used to stain the cell wall. Bar = 50 μm. B, Statistics analysis of fluorescence intensity for roots shown in A. Relative fluorescence intensity percentage in shsp22 plants was normalized to that in No-0 as 100%. Error bars represent ±sd (n = 10), *P < 0.05 and **P < 0.01.

