Figure 3.
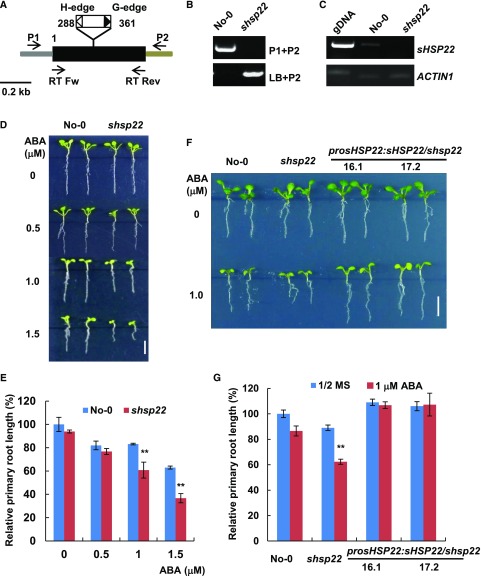
shsp22 exhibits enhanced sensitivity to ABA. A, Schematic representation of the Ds transposon insertion shsp22 mutant. The black box indicates the coding region, and the gray and brown bar indicates the 5′-and 3′-untranslated regions, respectively. The white and black triangles show the H-edge and G-edge of the Ds transposon, respectively. The numbers indicate the transposon insertion position. P1, forward primer; P2, reverse primer; LB, primer specific to the Ds transposon G edge. RT Fw and RT Rev were primers used for RT-PCR analysis. B, Diagnostic PCR of the Ds transposon inserted sHSP22. DNA from the homozygous insertion line of shsp22 was used. Primers used for PCR are indicated on the right of each lane. C, RT-PCR analysis of the sHSP22 transcripts in the wild-type and Ds transposon insertion mutant seedlings. The primer pairs used for RT-PCR are shown in A. ACTIN1 was used as an internal control. D, Primary root growth of the wild type and shsp22 on half-strength MS medium containing a range of ABA concentrations (0, 0.5, 1.0, and 1.5 μm). The seeds were germinated for 8 d in half-strength MS medium with or without ABA, and representative plants are shown. Bar = 0.5 cm. E, Statistics assay of relative primary root length in No-0 and shsp22 seedlings shown in D. Error bars represent ±sd of one biological replicate (n = 30); three biological experiments were performed. **P < 0.01. F, Root phenotypes of No-0, shsp22, and shsp22 complementation seedlings grown horizontally in half-strength MS medium with or without 1.0 μm ABA. Representative seedlings were shown after 9 d of growth. Bar = 0.5 cm. G, Statistics assay of relative primary root length in seedlings as shown in F. Error bars represent ±sd of one biological replicate (n = 30); three biological experiments were performed. **P < 0.01.

