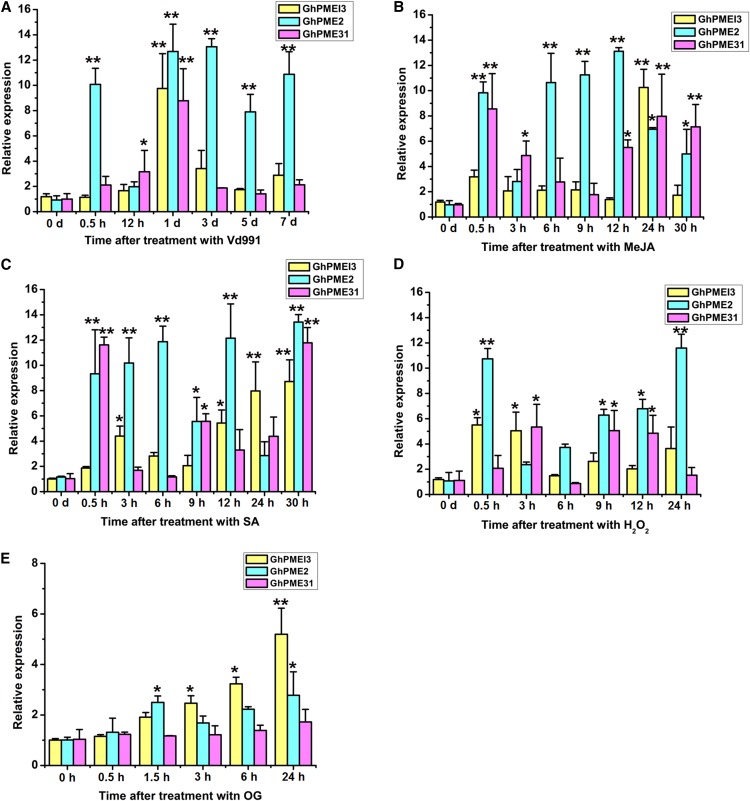
Figure 4.
GhPMEI3, GhPME2, and GhPME31 expression, as determined by RT-qPCR. A, GhPMEI3, GhPME2, and GhPME31 expression in cotton inoculated with Vd991 at 0 h, 0.5 h, 12 h, 1 d, 3 d, 5 d, and 7 d after infection. B, GhPMEI3, GhPME2, and GhPME31 expression in cotton after MeJA treatment (50 μm). Samples were analyzed 0, 0.5, 3, 6, 9, 12, 24, and 30 h after treatment. C, GhPMEI3, GhPME2, and GhPME31 expression after ET treatment (10 μL/L). Samples were analyzed 0, 0.5, 3, 6, 9, 12, 24, and 30 h after treatment. D, GhPMEI3, GhPME2, and GhPME31 expression after H2O2 treatment (1% [v/v]). E, Induction of GhPMEI3, GhPME2, and GhPME31 expression in the presence of 100 μg/mL OG, harvested at the indicated times. For the MeJA, ET, and H2O2 treatments, plants treated with double-distilled water were used as controls; for the treatment with Vd991, samples treated with Czapek medium were used as a control. Data were collected from three independent biological replicates. The data are presented as the means ± se (n = 3). Asterisks indicate a significant difference from the control (least significance difference, lsd, test; *P < 0.05, **P < 0.01).

