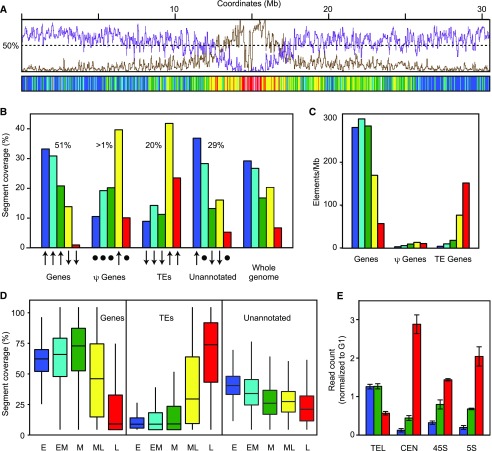
Figure 4.
Distribution of genomic features in replication timing segments. A, Comparison of replication timing with gene and TE profiles. Coverages of genes (magenta) and TEs (brown) on chromosome 1 were determined using Araport11 annotation and expressed as percentage of bases in 1-kb nonoverlapping bins. The data were smoothed using a 50-kb window and overlaid with IGV tracks. The distribution of replication timing segments along chromosome 1 is below. B, Distribution of genomic features in RT classes. Coverage of each type of feature in the RT classes is expressed as the percent of total coverage for that feature. The percentages indicate the cumulative genome coverage of each feature. The total exceeds 100% because features can be located on both DNA strands. The arrows indicate how RT coverage for each feature departs from the expected value based on relative genome coverage (χ2 adjusted residuals; Supplemental Table S2). Upward arrows are enriched (upper tertile), downward arrows are depleted (bottom tertile), and the circles are no difference (central tertile). C, Density of genes, pseudogenes, and TEs in each RT class. The number of genomic features overlapping segments of each RT class was scored and normalized to the total genomic coverage of that feature. D, Fraction of RT classes overlapping with genomic features. The overlap between replication timing segments and genes, TEs, and unannotated regions is expressed as the percentage of total coverage for segments for each RT class. Box plots show the distribution of relative overlap between the genomic features and replication timing segments. The unannotated portion of the genome was obtained by subtracting all the annotated features from the genome. E, Replication time for four groups of repetitive sequences. Raw reads from early, mid, and late S phase were aligned (BLAST E-value < 1e-8) to telomeric-related (TEL), centromeric-related (CEN), 45s, and 5s ribosomal DNA consensus sequences. The number of reads matching the query sequences was normalized to number of G1 reads for each sequence. The error bars indicate the sd of the three biological replicates for each S-phase population.

