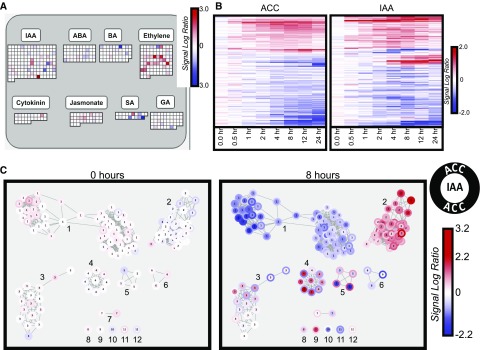
Figure 4.
Ethylene regulates many hormone synthesis, signaling, and response genes. A, Image generated using the Regulation Overview in the MapMan Application Software. Squares under a given hormone represent genes/transcripts annotated to that hormone’s synthesis, signaling, or response. The color scale designates the greatest absolute SLR across the time course for each transcript. IAA, Indole-3-acetic acid; ABA, abscisic acid; BA, brassinosteroid; SA, salicylic acid; GA, gibberellic acid. B, The 139 ACC and IAA DE overlap transcripts, with average SLR across the time course shown for both hormone treatments. C, Network map showing clusters of 139 ACC and IAA DE overlap transcripts.

