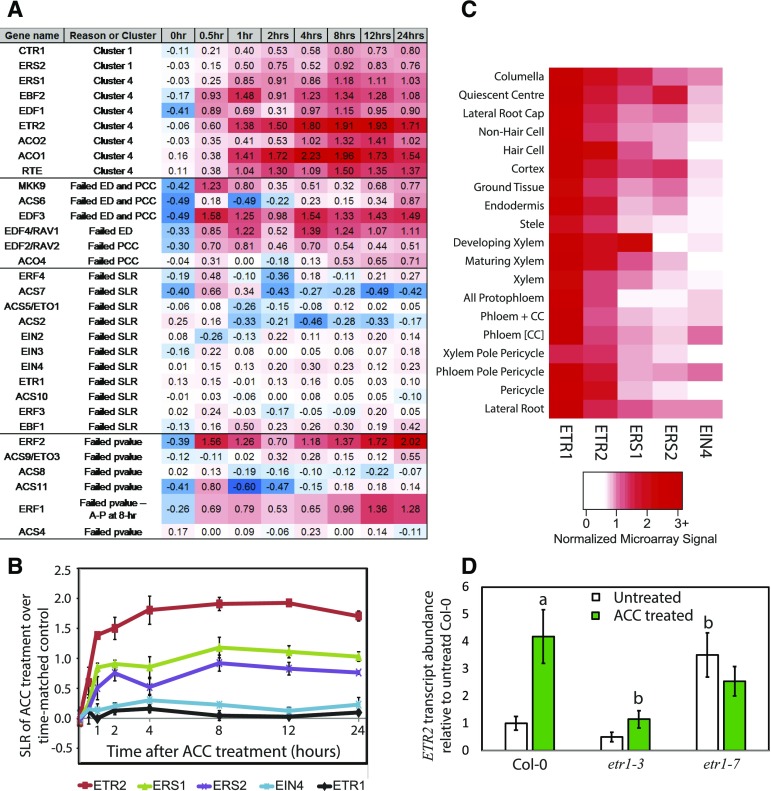
Figure 8.
Ethylene controls many ethylene synthesis, signaling, and response genes, including expression of the ethylene receptor ETR2 in an ETR1-dependent manner. A, For each ethylene-related transcript queried from our data set, the results represent the DE cluster where it is found or where it failed in the filtering process. SLRs represent averages of three biological replicates. Red, white, and blue designate positive, zero-value, and negative SLRs, respectively (see color scale). B, The SLR patterns for five ethylene receptor transcripts show different kinetic responses to ACC treatment. SLRs are reported as averages with se as a function of time after ACC treatment from the microarray data set. C, The cell type-specific expression pattern of each of the receptors illustrated with relative levels of transcripts using a percentage scale for the normalized signal values from Brady et al. (2007). D, Transcript abundance in receptor mutants as determined by qRT-PCR. Nine-day-old seedlings were transferred to agar medium with and without ACC at 1 µm for 24 h before RNA extraction and quantification by qRT-PCR. Averages of three biological replicates are reported. The significance of ACC treatment within a genotype and between Col-0 and the indicated genotypes was assessed by ANOVA and Tukey’s posthoc test, and significant differences are indicated. aSignificant difference between treatments, at P < 0.0003; bsignificant difference between genotypes within treatments, at P < 0.003.

