Figure 4.
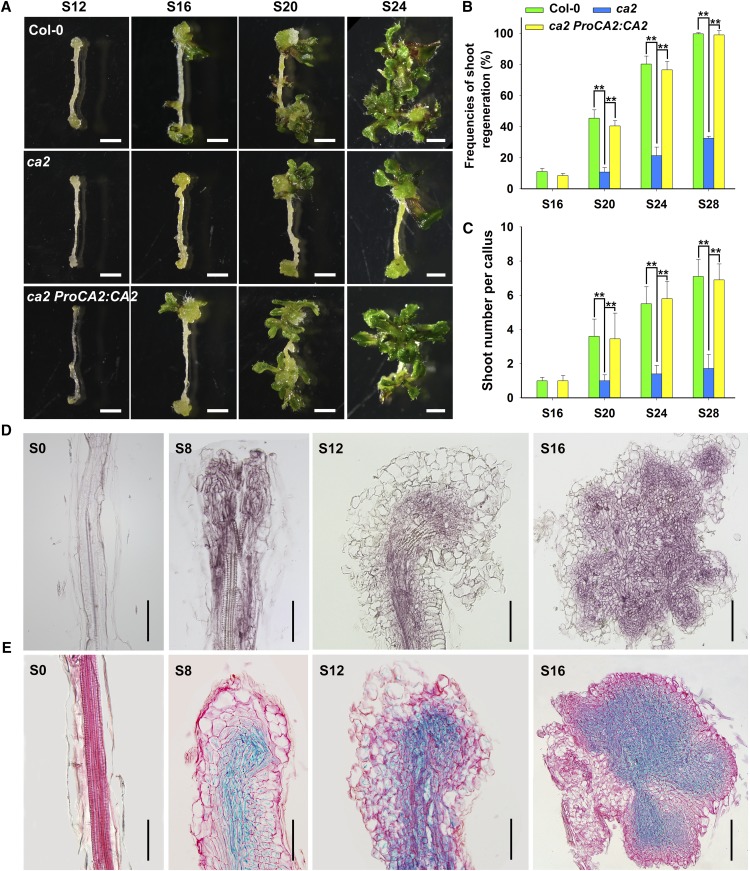
Loss of function of CA2 caused the decreased capacity of shoot regeneration. A to C, Callus morphology (A), frequencies of shoot regeneration from calli (B), and number of shoots per callus (C) in wild-type Col-0, ca2, and ca2 ProCA2:CA2 cultured on SIM at the indicated times. D, Expression pattern of CA2 detected by in situ hybridization in calli of Col-0 at the indicated times on SIM. E, Expression pattern of CA2 detected by GUS staining in calli of ProCA2:CA2-GUS transgenetic lines at the indicated times on SIM. S0 represents calli cultured on CIM at 6 d using roots as explants before transfer to SIM. S8, S12, S16, S20, S24, and S28 indicate calli cultured on SIM at 8, 12, 16, 20, 24, and 28 d, respectively. se values were calculated from three sets of biological replicates, and more than 100 calli were examined in each replicate. Asterisks indicate significant differences: **, P < 0.01 (Student’s one-tailed t test). Bars = 500 µm.

