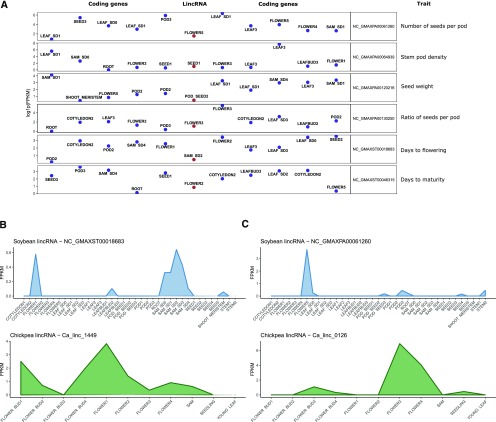
Figure 6.
Analysis of potential trait-related lincRNAs. A, For each of the putative trait-related lincRNAs, the plot presents 11 genes found in close vicinity of trait-associated SNP (1 putative trait related lincRNA + 5 downstream protein-coding genes + 5 upstream protein-coding genes). Each dot point represents a gene (red, lincRNA; blue, protein-coding gene) and is labeled with sample with peak expression (y axis represents actual expression value). B and C, Expression of lincRNA in soybean samples and its positional ortholog in chickpea. The x axis corresponds to samples. The y axis corresponds to the FPKM values.

