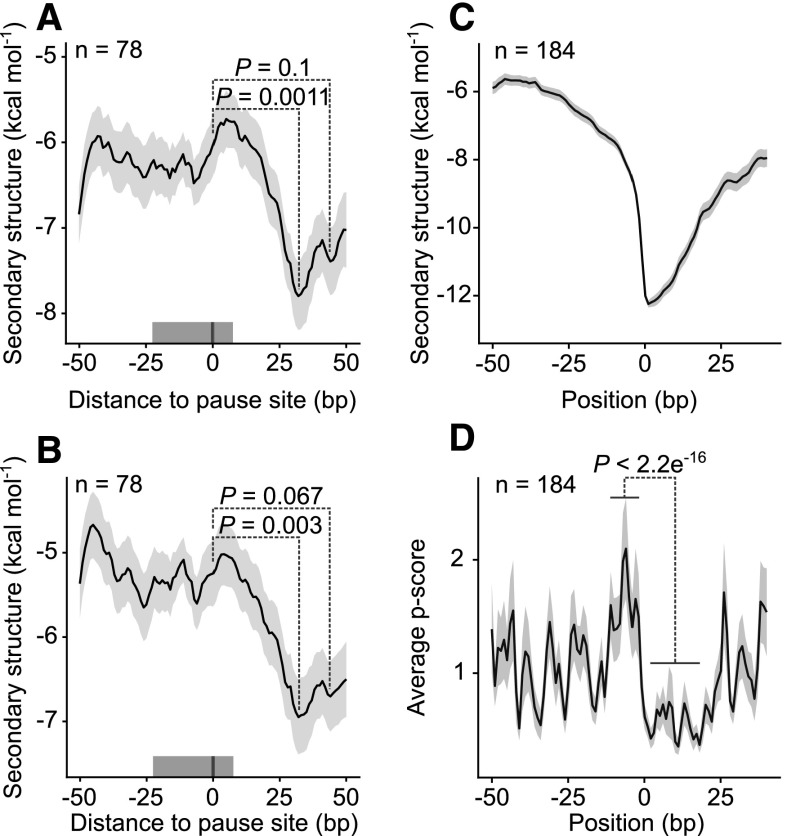
Figure 1.
Correlation of ribosome pause sites with the presence of stable mRNA secondary structures downstream. A, Predicted distribution of mRNA structures around 78 pause sites with a pause score calculated per nucleotide above 50 (position 0; see “Materials and Methods”). The line shows the running mean MFE; the shaded area around it indicates the mean ± se. The mean was calculated using a centered 51-nucleotide sliding window. The P values (Wilcoxon rank sum test) show that the stability of secondary structure is statistically significantly higher downstream of pause sites than at the sites themselves. The gray bar above the x axis represents the region occupied by the ribosome. B, The mRNA structure around the same pause sites, as determined in vivo (Ding et al., 2014). C, For the converse analysis, regions centered on the structure (10% strongest mRNA structures, MFE < −11.1, position 0; Supplemental Fig. S4) and with maximally two sites with MFE < −11.1 between positions −50 and −1 were selected (n = 189). The line shows the running mean of MFE; the shaded area around it is the mean ± se. D, Ribosome pausing measured by the pause score (p score) at the 10% most stable mRNA structures shown in C. There is statistically significantly more pausing at positions from −12 to −2 relative to region from 1 to 19 (Wilcoxon rank sum test). The solid line shows the mean of the pause score, with the shaded area representing the mean ± se.

