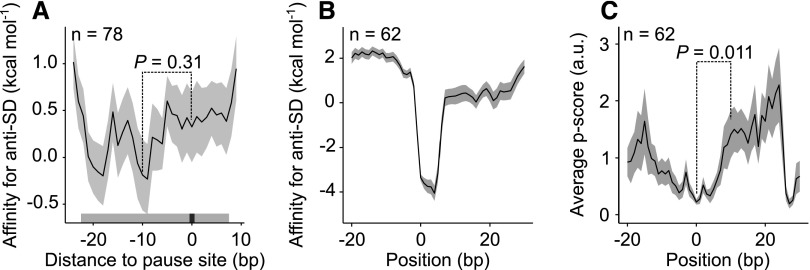
Figure 2.
Correlation of ribosomal pause sites with internal SDs located upstream. A, Affinity of sequences in the vicinity of 78 ribosome pause sites with calculated pause scores per nucleotide > 50 (position 0; see “Materials and Methods”) to the aSD motif in the 16S rRNA. The P values (Wilcoxon rank sum test) demonstrate that this trend is not statistically significant. The gray bar above the x axis represents the region occupied by the ribosome. B, aSD/mRNA interaction near the strongest 19.9% of internal SDs (ΔG < −2 kcal mol−1; Supplemental Fig. S9). C, Ribosome pausing measured by the pause score (p score) at the strongest 19.9% of internal SDs. There is statistically significantly more pausing at position 10 relative to the 5′ end of the SD (Wilcoxon rank sum test).

