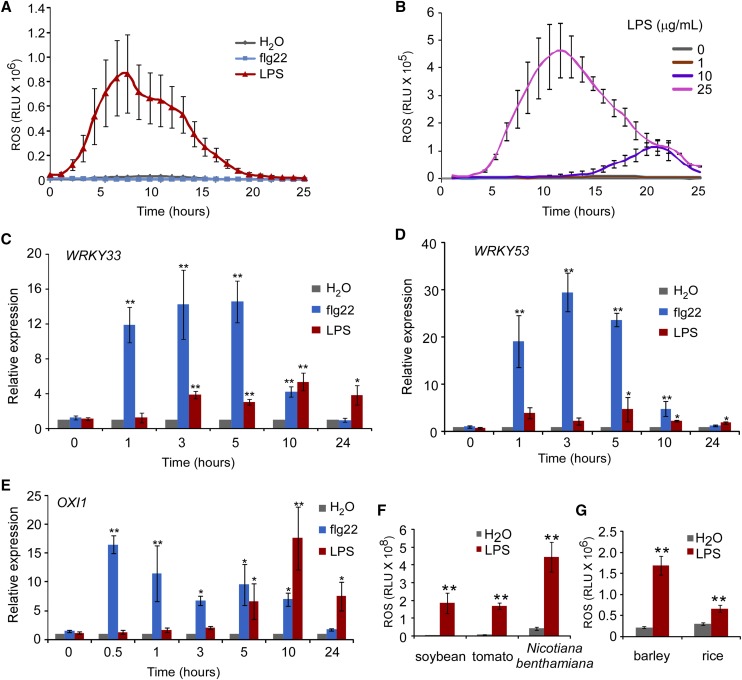
Figure 2.
LPS trigger an ROS burst. A and B, LPS-induced second ROS burst. ROS production was monitored using a chemiluminescence assay with luminol as a substrate. Leaf disks were punched from 4-week-old mature plants. LPS (50 μg/mL) and flg22 (100 nm) were used in A. The LPS concentration in B is indicated in the figure. Signals were recorded for 24 h after treatment. The data are shown as means ± se (n = 8). C to E, WRKY33 (C), WRKY53 (D), and OXI1 (E) gene expression. Gene expression was quantified by RT-qPCR. RNA was extracted from 10-d-old seedlings at the indicated time points after treatment. UBQ10 was used as the reference gene. The data are shown as means ± se from three biological replicates. Asterisks indicate significant differences from the value at the 0 h time point (Student’s paired t test: *P ≤ 0.05, **P ≤ 0.01). F and G, ROS burst in representative dicot (F) and monocot (G) species after LPS treatment. The bar graph indicates the total integrated photon counts within 24 h after treatment. The data are shown as means ± se (n = 8). Asterisks indicate significant differences between LPS and control treatments (Student’s paired t test: *P ≤ 0.05, **P ≤ 0.01). LPS (50 μg/mL) and flg22 (100 nm) were used in these assays. All experiments were repeated twice with similar results.

