Figure 3.
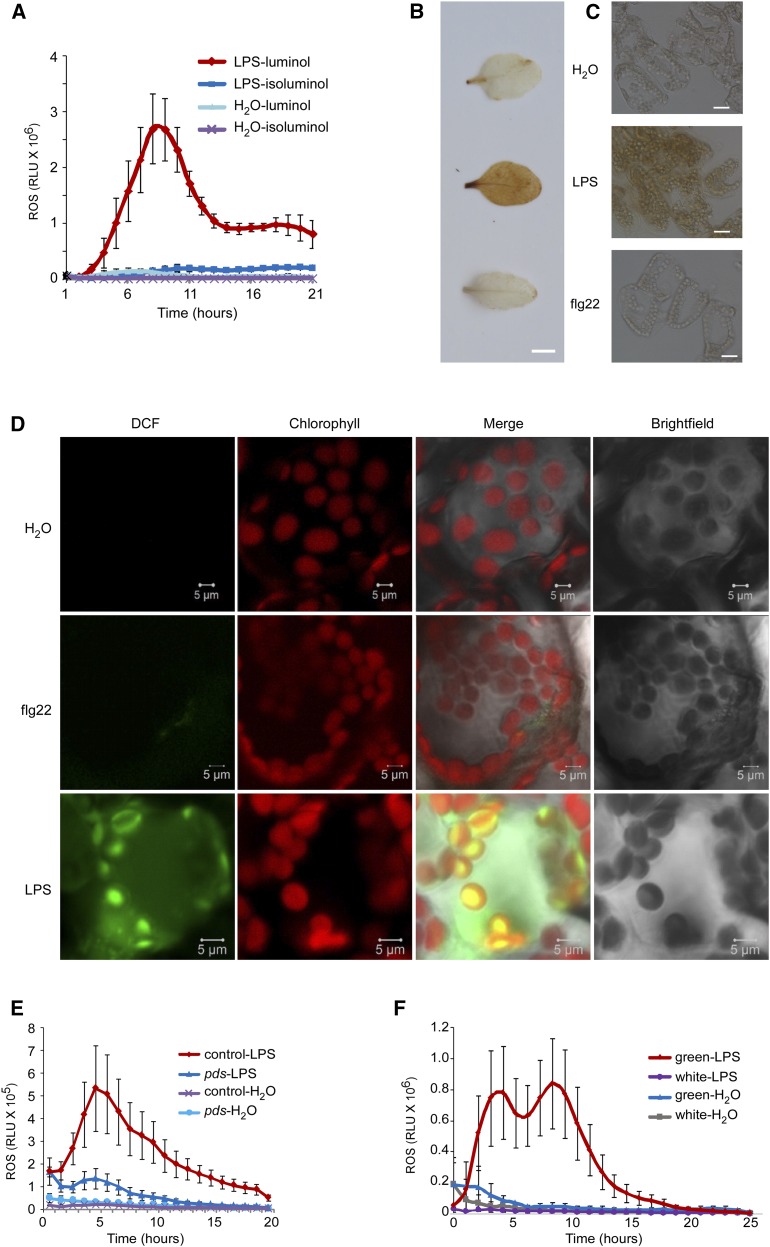
The LPS-triggered second ROS burst is associated with chloroplasts. A, ROS burst. ROS were monitored using a chemiluminescence assay with either luminol or isoluminol as a substrate. Leaf disks were punched from 4-week-old mature plants. Signals were recorded for 21 h after LPS (50 μg/mL) or water treatment. B and C, Accumulation of H2O2 in 4-week-old leaves. H2O2 generation was detected by DAB staining 8 h after water, LPS (50 μg/mL), or flg22 (100 nm) treatment. The brown color indicates strong H2O2 production. DAB-stained leaves in B were examined under a microscope (C). Bars = 5 mm (B) and 20 μm (C). D, Fluorescence detection of intracellular ROS. Two-week-old seedlings were treated with water, LPS (50 μg/mL), or flg22 (100 nm) for 1 h. ROS were detected by CM-H2DCFDA staining. ROS fluorescence (green) and chlorophyll autofluorescence (red) were analyzed under a confocal microscope. Bars = 10 μm. E, ROS burst in PDS-silenced leaves. PDS was silenced in tomato leaves using the virus-induced gene silencing (VIGS) approach. The empty vector was used as a negative control. Leaf disks were punched 20 d after VIGS. ROS production was monitored for 20 h after LPS (50 μg/mL) or water treatment using a chemiluminescence assay with luminol as a substrate. F, ROS burst in Arabidopsis var2 mutants. Leaf disks from white sectors and green sectors of var2 mutants were used for measurement of ROS. ROS were monitored for 24 h after LPS (50 μg/mL) or water treatment using a chemiluminescence assay with luminol as a substrate. The data (A, E, and F) are shown as means ± se (n = 8). All experiments were repeated twice with similar results.

