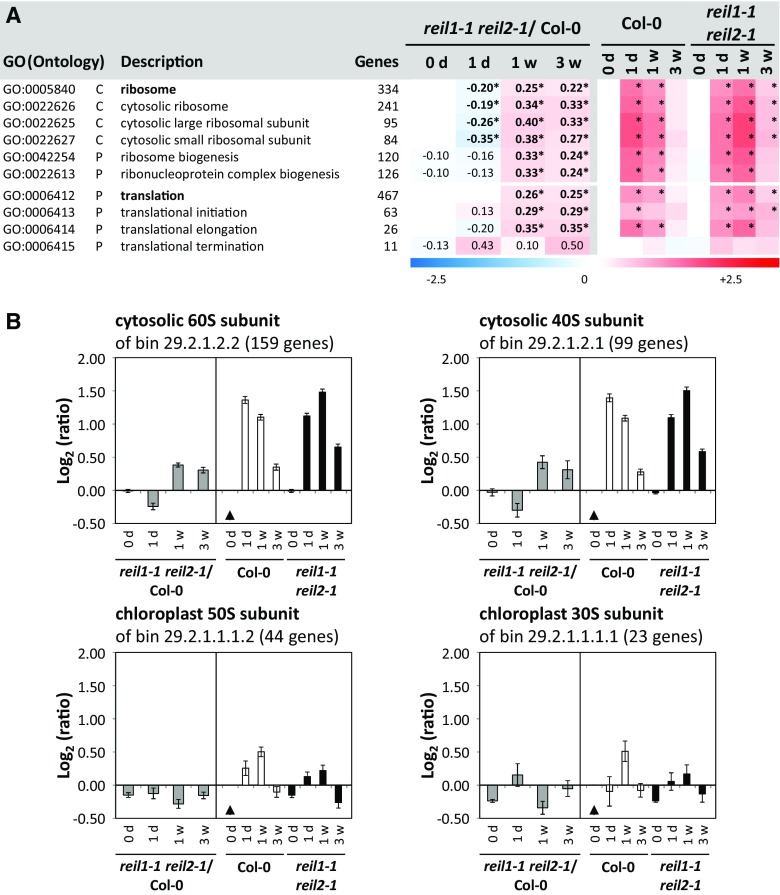
Figure 10.
Functional enrichment analysis of ribosome- and translation-related gene expression in reil1-1 reil2-1 compared with Col-0 in the nonacclimated state and after the shift to 10°C. A, Heat map of mean log2-FCs from structural ribosome- and translation-related GO terms and selected more specified subterms. reil1-1 reil2-1/Col-0 columns represent mean log2-FCs > +0.1 or < −0.1 of mutant expression ratios compared with Col-0 in the nonacclimated state (0 d) and at the time points after the shift to 10°C, 1 d (1d), 1 week (1w), and 3 weeks (3w). Log2-FCs with significant positive or negative enrichment (i.e. z-score values > 2.5) are indicated by asterisks. Columns reil1-1 reil2-1 and Col-0 at 0d, 1d, 1w, and 3w represent mean log2-FC of expression ratios relative to nonacclimated Col-0. Information was extracted from mean log2-FCs, z-scores, and P values of a differential gene expression enrichment analysis covering genes belonging to 1,940 GO terms (Du et al., 2010; Supplemental Table S4). B, Mean log2-FC (±se) of cytosolic and chloroplast structural genes as defined by MapMan/PageMan functional bin annotations (Thimm et al., 2004; Usadel et al., 2006). Gray bars in each left subgraph are expression ratios of reil1-1 reil2-1/Col-0 at each given time point. Black and white bars in the right subgraphs represent the ratios relative to nonacclimated Col-0 (black triangles).

