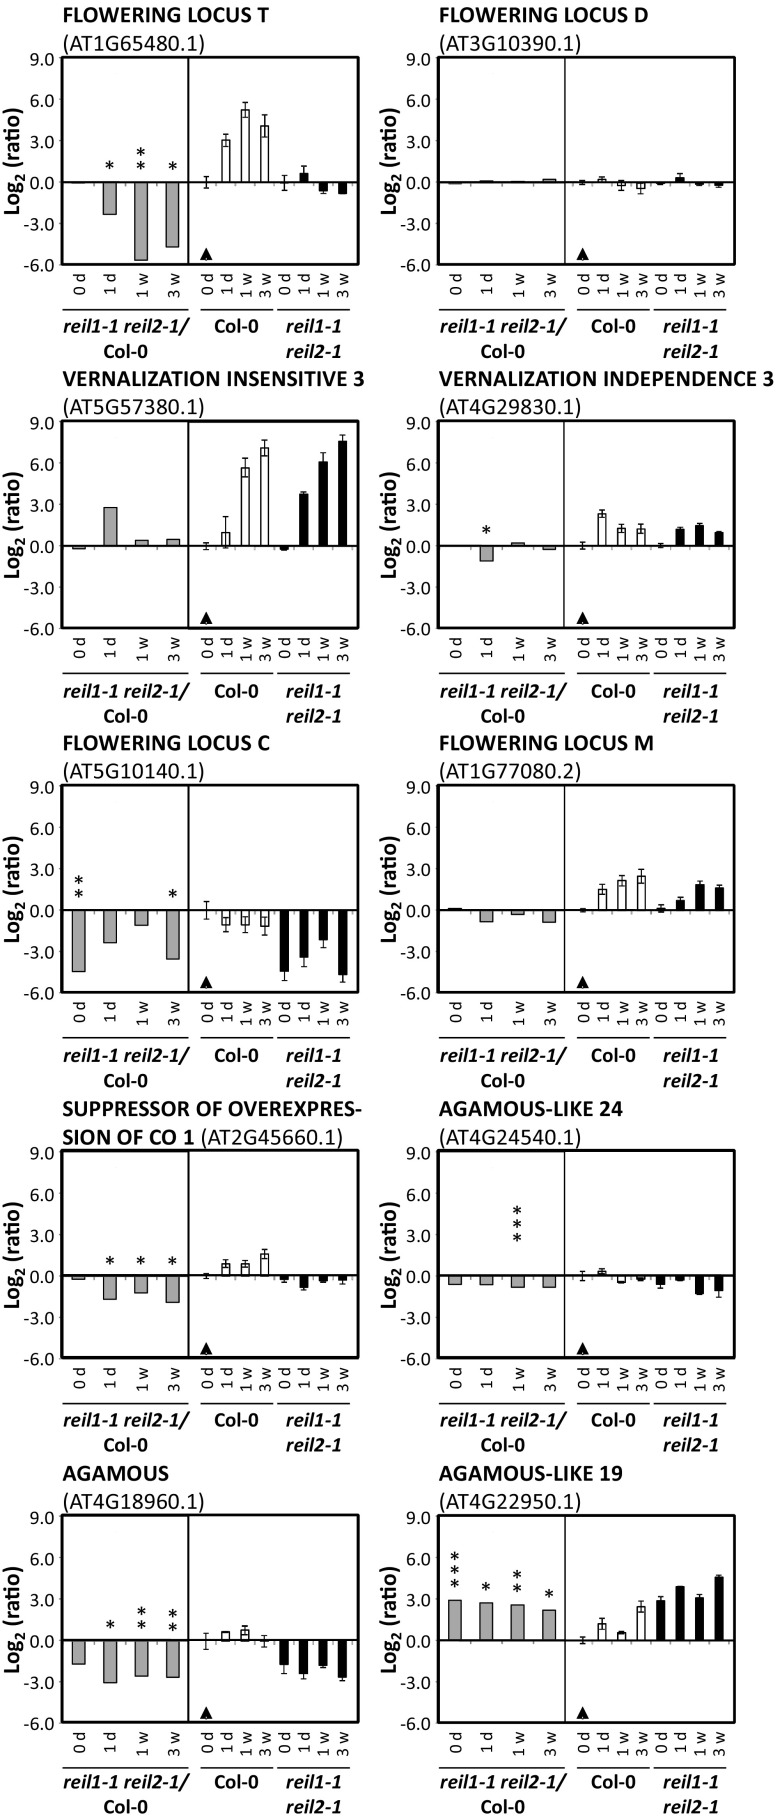
Figure 11.
Selected differentially expressed flowering-related genes of nonacclimated (0 d) and 10°C cold-acclimating reil1-1 reil2-1 at 1 d (1d), 1 week (1w), or 3 weeks (3w) after the shift to 10°C. Relative expression values are mean log2-FC (±se). Gray bars in each left subgraph are expression ratios of reil1-1 reil2-1/Col-0 at the given time points. Black and white bars in the right subgraph represent the ratios relative to nonacclimated Col-0 (black triangles). *, 0.01 < P ≤ 0.05; **, 0.001 < P ≤ 0.01; and ***, P ≤ 0.001, by heteroscedastic Student’s t tests.

