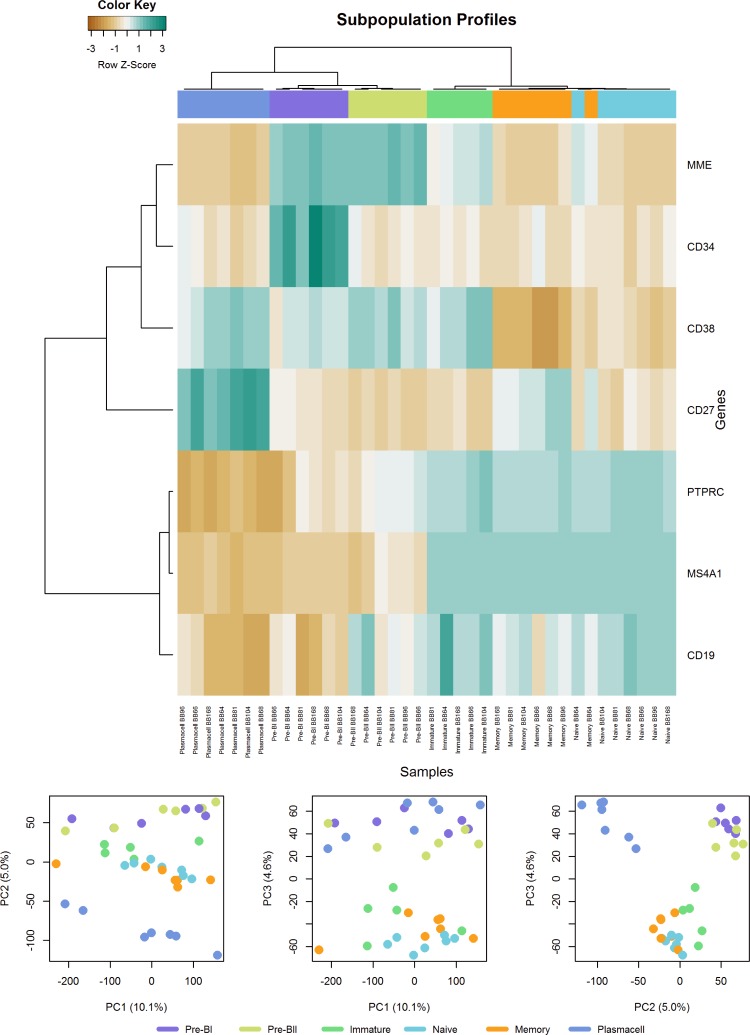
Fig 1. Quality assessment of the normal B-cell subsets.
a) Unsupervised clustering of surface marker genes in the six normal B-cell subsets. Heat map showing unsupervised hierarchical clustering of normal B-cell subsets based on their expression of the cell surface markers used for FACS. The color scale indicates relative gene expression: brown, low expression; blue, high expression. Color codes: pre-BI, purple; pre-BII, yellow; immature, green; naïve, turquoise; memory, orange; and plasma cells, blue. (b) Principal component analysis of the global gene expression (in total 39,115 genes) in normal B-cell subsets. 1st, 2nd, and 3rd principal components are shown and plotted against each other.

