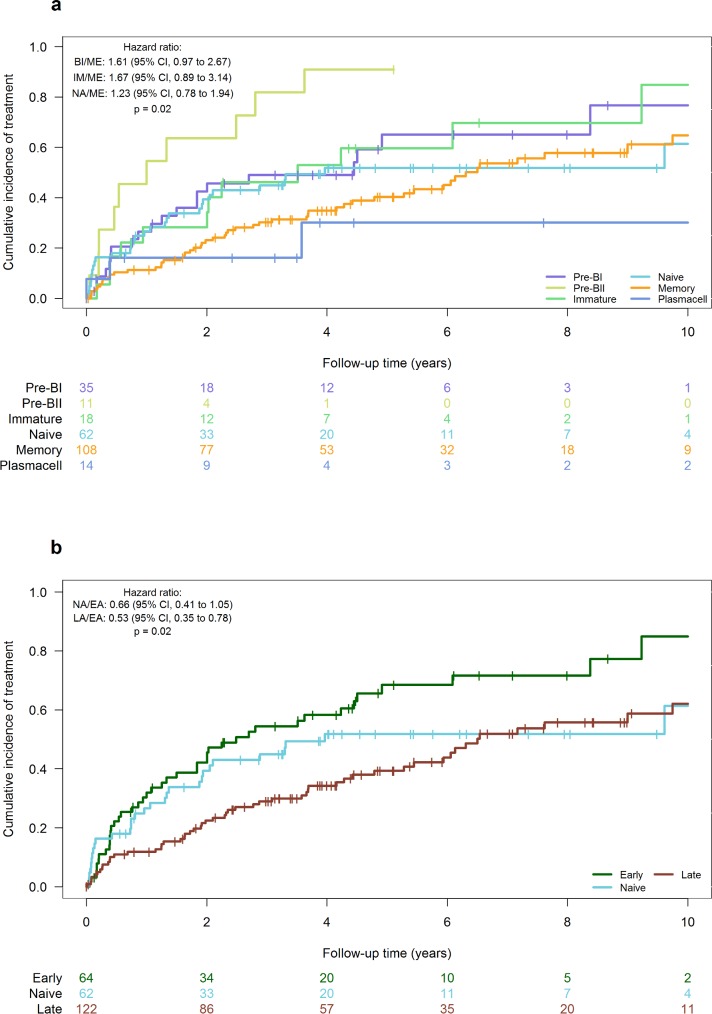
Fig 2. Analyses of the prognostic impact of subtyping according to BAGS on TTT in watch-and-wait CLL.
Cumulative incidence curves show years elapsed from the time of diagnostic GEP until the commencement of initial treatment. (a) All subtypes. (b) All subtypes divided as early (pre-), naïve, and late (post-germinal). Color codes as in Fig 1. Data from both the Munich, IIDFCI, and UCSD cohort were used (n = 296).

