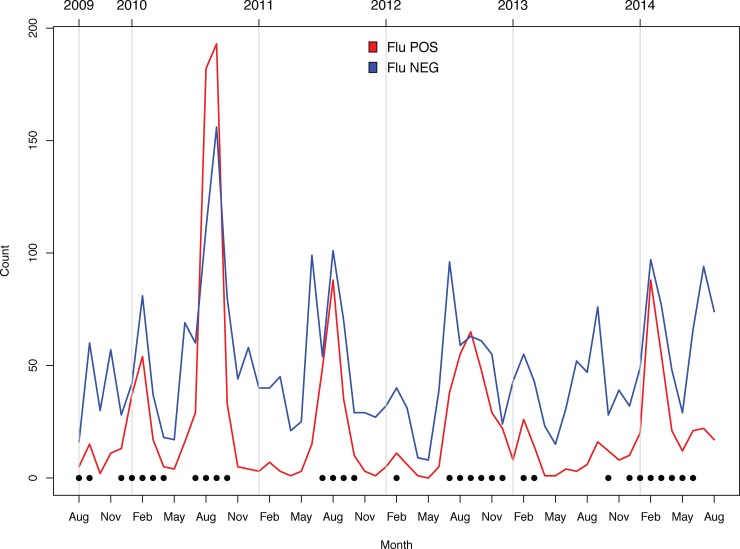
Fig 1. Temporal distribution of ILI cases testing positive for influenza infection (RED) and negative for influenza infection (BLUE).
Solid circles indicate months identified as experiencing influenza outbreaks (defined as months wherein > = 25% of ILI specimens tested positive for influenza infection by RT-PCR).

