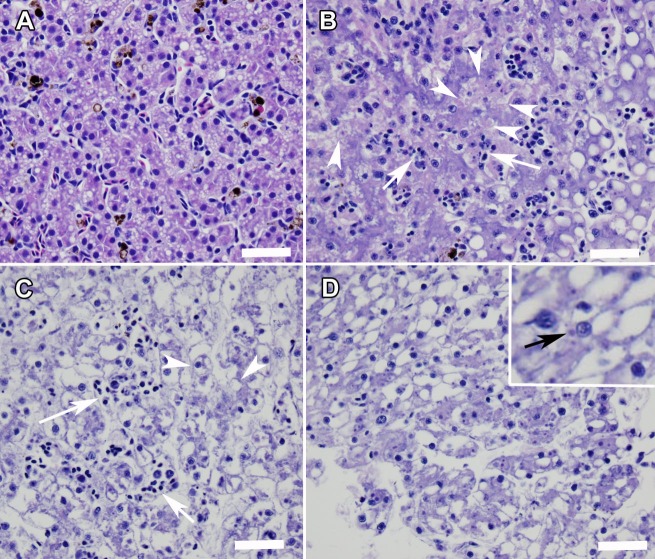
Fig 4.
Sections of liver from a control animal (A) and from ranavirus qPCR positive animals demonstrating ranaviral disease (B-D). (B) Necrosis of hematopoietic cells (arrows) and degeneration and necrosis of hepatocytes (arrowheads) in a liver from an amphibian co-housed for 60 minutes in a container where 40% of the amphibians were infected with ranavirus. (C) Diffuse necrosis of hematopoietic cells (arrows) and hepatocytes (arrowheads) in a liver from an amphibian processed in a simulated swabbing event where 10% of the amphibians were infected with ranavirus and gloves were not changed during processing. (D) Intracytoplasmic inclusion bodies (inset) and diffuse necrosis of hematopoietic cells and hepatocytes in a liver from an amphibian processed in a simulated swabbing event where 40% of the amphibians were infected with ranavirus and gloves were not changed during processing. Hematoxylin and Eosin stain. Bar equals 50 μm.

