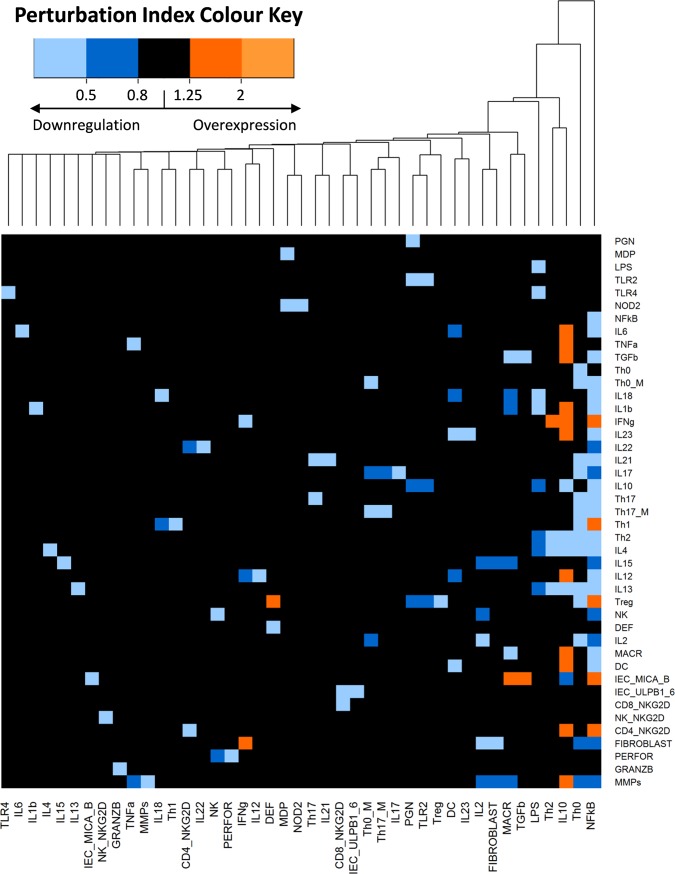
Fig 2. IBD network perturbation analysis and clustering.
The heatmap indicates the effect of single blockage of each node (columns) in every network node (rows). The colour in each cell corresponds to the Perturbation Index (PI) of the nodes. When there is no change in the expression of the node, the cells of the heatmap would be black, having a value between 0.8 and 1.25 in their PIs. Otherwise, when the perturbation causes an overexpression in a node, the cell in the heatmap would be orange coloured, with PIs values greater than 1.25. On the contrary, a value of 0.8 or smaller, blue colour, indicates that the perturbation causes a downregulation of the node. The numeric scale in the legend represents different values of the nodes PI under different perturbations. Nodes that induce similar alterations are hierarchically clustered.

