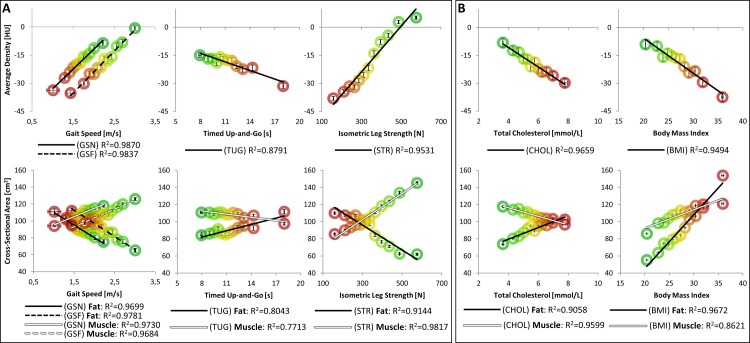
Fig 2. Current CT standard analyses against A) LEF biometrics and B) SCHOL and BMI.
Note that each population bin is shown with colored circles ranging from the unhealthiest (red) to the healthiest group (green), as defined by each parameter. Regression lines are likewise shown for each data series, along with their respective coefficients of determination (R2).

