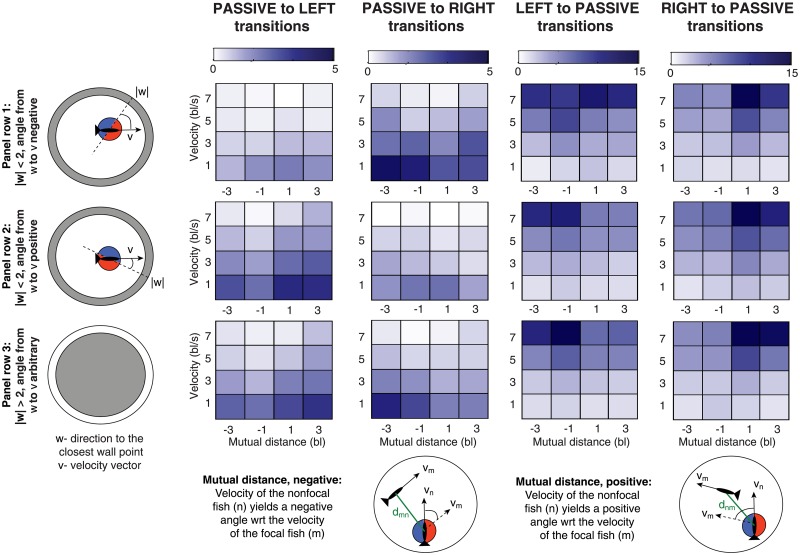
Fig 8. Transition rates inferred from tracked zebrafish data for the model with three kinematic variables.
Transition types are indicated in column headings. For each transition type, λ(s → s′), from state s to s′, the rates are shown by color intensity (colorbar on top), as a function of mutual distance u3 (horizontal axis), velocity magnitude u1 (vertical axis) and wall distance u2 (three rows, see legends at left). We used bin centers {1, 3, 5, 7} for the velocity magnitude u1, bin centers {−3, −1, 1, 3} for the mutual distance u3 and the wall distance is split to three bins: u2 ∈ [−2, 0), [0, 2], and |u2| > 2. The rates were inferred jointly from two experiments, each with two fish; the rates were assumed to be the same for all the fish.

