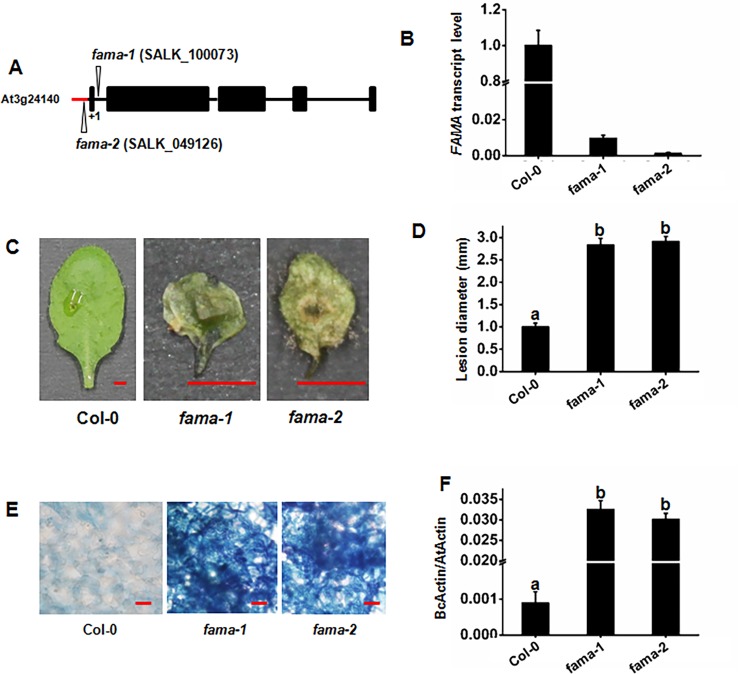
Fig 3. fama mutants display increased susceptibility to B. cinerea infection.
(A) Gene organization of FAMA. T-DNA insertions are shown for fama-1 (SALK_100073) and fama-2 (SALK_049126). Closed boxes, exons; black solid lines, introns; red solid lines, 5’ UTR; The translational start sites (ATG) are shown as +1. (B) RT-qPCR of FAMA at 14 d after germination of fama-1 and fama-2, and their respective wild-type lines (Col-0) using Actin7 as a control. Error bars indicate 95% confidence intervals (n = 3). (C) (D) Disease symptoms and lesion sizes on the B. cinerea-infected WT, fama-1, and fama-2 leaves. (E) Trypan blue staining of B. cinerea fungal hyphae growing on leaves at 2 d. Bars = 100 μm. (F) Fungal growth on the B. cinerea-infected WT, fama-1, and fama-2 leaves. The disease assay was performed as indicated (see Results and Methods) on the leaves of soil-grown plants. Photos (C) were taken at 2 d. Bars = 2.5 mm. Fungal growth in planta was assumed by analyzing the transcript levels of the BcActinA gene by RT-qPCR using Actin7 as an internal control 2 d after inoculation (F). Average values and SEM from relative values obtained in three biological replicates were plotted on the graph (D) (F). A minimum of 10 leaves for each genotype was used for each biological replicate, and the disease assay was repeated three times, with similar results. The mean values followed by different letters represent significant differences (P< 0.01, Student’s t-test).

