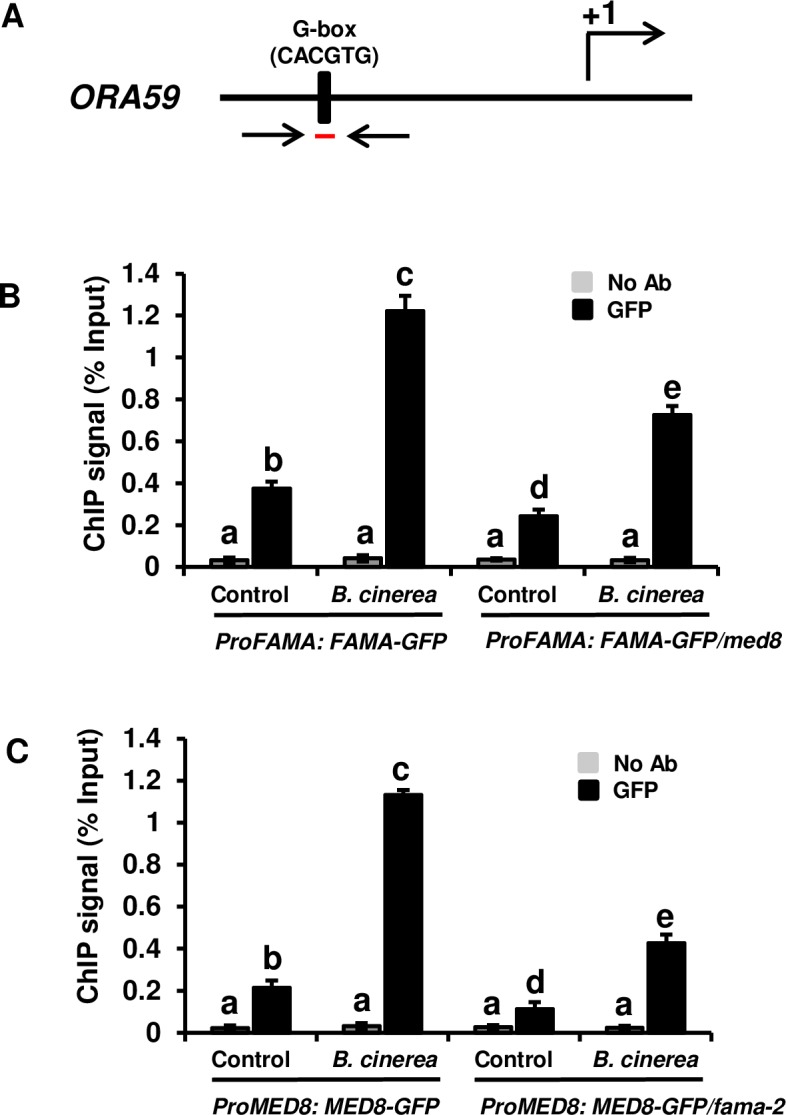
Fig 7. FAMA and MED8 can occupy the G-box region in the promoter of ORA59.

(A) Schematic diagram of the promoter regions of ORA59. The black line represents the promoter region of the gene. The black box on the line indicates the putative G-box cis-elements (CACGTG) of the ORA59 promoter. The region between the two coupled-arrowheads (red line) indicates the DNA fragments used for the ChIP-PCR. The translational start sites (ATG) are shown as +1. (B) FAMA could occupy the G-box region in the promoter of ORA59, and MED8 affects the recruitment of FAMA to the promoter of ORA59. The ProFAMA: FAMA-GFP and ProFAMA: FAMA-GFP /med8 transgenic seedlings were used in ChIP using an anti-GFP antibody (Millipore). ProFAMA: FAMA-GFP and ProFAMA: FAMA-GFP /med8 seedlings were inoculated with B. cinerea for varying lengths of time (0 and 36 h) before cross-linking. The “No Ab” immunoprecipitates served as negative controls. The ChIP signal was quantified as the percentage of total input DNA by RT-PCR. Average values and SEM from relative values obtained in four biological replicates were plotted on the graph. The ChIP assay was repeated at least four times, with similar results. The mean values followed by different letters represent significant differences (P< 0.01, Student’s t-test). (C) MED8 could occupy the G-box region in the promoter of ORA59, and FAMA affects the recruitment of MED8 to the promoter of ORA59. The ProMED8: MED8-GFP and ProMED8: MED8-GFP /fama-2 transgenic seedlings were inoculated with B. cinerea for varying lengths of time (0 and 36 h) before cross-linking. The “No Ab” immunoprecipitates served as negative controls. The ChIP signal was quantified as the percentage of total input DNA by RT-PCR. Average values and SEM from relative values obtained from four biological replicates were plotted on the graph. The ChIP assay was repeated at least four times, with similar results. The mean values followed by different letters represent significant differences (P< 0.01, Student’s t-test).
