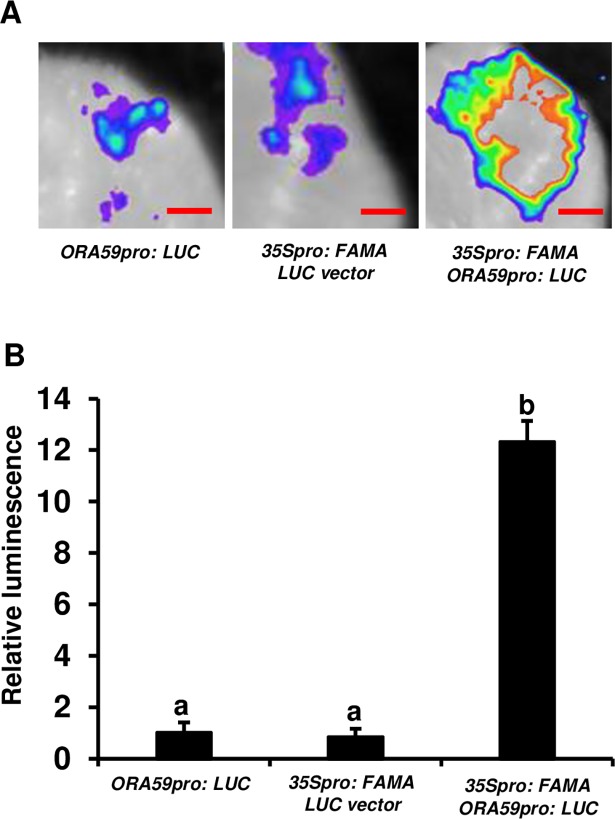
Fig 8. FAMA can activate the expression of ORA59.
(A) Transient expression assays showing that the overexpression of FAMA could activate ORA59 expression. Representative images of N. benthamiana leaves 72 h after infiltration are shown. The bottom panel indicates the infiltrated constructs. Bars = 2.5 mm. (B) Quantitative analysis of luminescence intensity in (A). Average values and SEM from relative values obtained in four biological replicates were plotted on the graph. The transient expression assay was repeated at least four times, with similar results. The mean values followed by different letters represent significant differences (P< 0.01, Student’s t-test).

