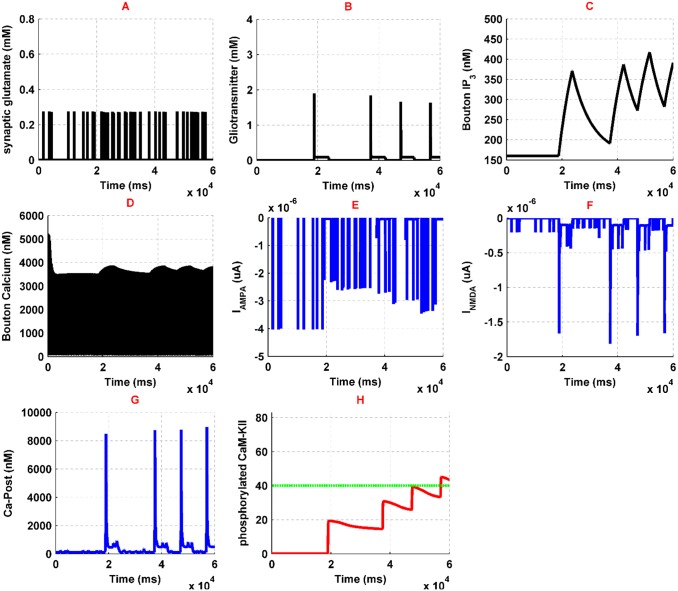
Fig 7. Simulation results for normal condition has been denoted here.
Synaptic glutamate is shown in (A), gliotransmitter dynamics is denoted in (B), presynaptic IP3 variation and Ca2+ oscillations are shown in (C) and (D), respectively; AMPAR and NMDAR currents are denoted in (E) and (F), postsynaptic Ca2+ is shown in (G), phosphorylated CaMKII and NOs threshold are shown in (H) by red and green curves, respectively.

