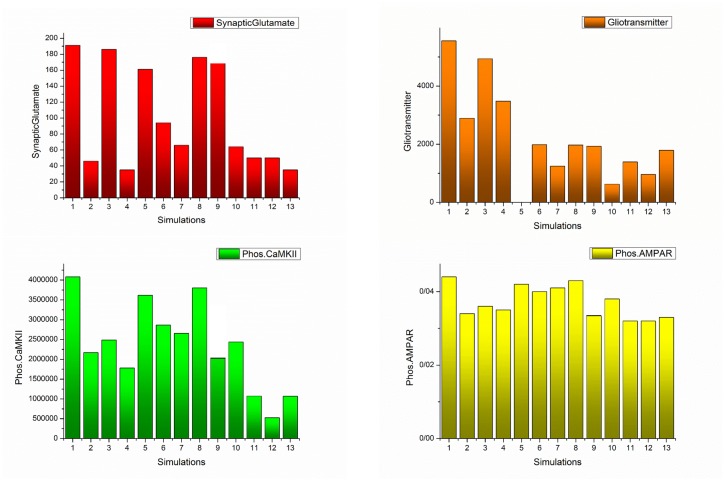
Fig 10. Box and whisker plot for different simulations have been described here.
Redline shows the median of the signals, ‘+’ sign represents the mean value of each signal, blue line demonstrates that 25%-75% of data are included in this range, and finally black line shows the range that 9%-91% of the dada are included. Panel A shows the synaptic glutamate, Panel B denotes the gliotransmitter, Panel C describes the phosphorylated CaMKII, and Panel D represents the Phosphorylated AMPARs. In the first simulation, all of the synaptic components are affected by morphine and the simulation of 13th indicates normal mode. In the second simulation, the effect of morphine on presynaptic neurons has been neglected. In the third simulation, postsynaptic μORs are assumed to be inactive. In the fourth simulation, morphine only affects astrocyte. In the fifth simulation, the release of the gliotransmitter is considered zero. In the sixth simulation, it is assumed that despite the effect of morphine on all the components of the synapse, astrocytic GLTs act normal. In the seventh simulation, under conditions where morphine affects all of the synaptic components, the activity of astrocytic transporters is stimulated to be 50% greater than normal. In the eighth simulation, the activity of astrocytic mGlurs is considered zero. The ninth simulation shows that astrocytic mGlurs and postsynaptic μORs are not active. In the tenth simulation, astrocytic transporters are stimulated 50% more than normal, and astrocytic mGlurs have been deactivated. In the eleventh simulation, by stimulating astrocytic transporters, NMDA receptors have a normal synaptic effect. In the 12th simulation, astrocytic mGlurs have been deactivated, astrocytic transporters are stimulated, and NMDARs act as normal.

