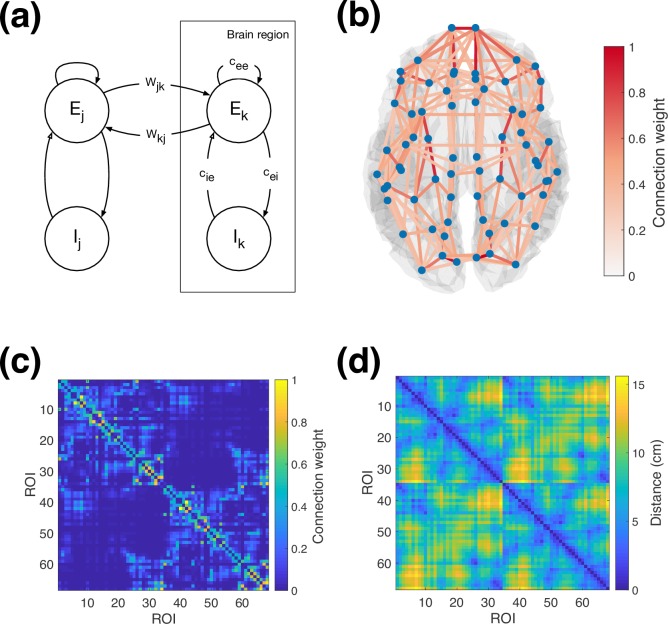
Fig 1. Overview of model structure.
(a) Schematic of Wilson-Cowan neural populations and connections between, both within and between brain regions. (b) Overview of parcel centres and connectivity between them from the Desikan-Killiany parcellation and tractography. The strongest 10% of connections are displayed. (c) Anatomical connectivity matrix used for simulations (d) Distance matrix used for simulations. The labels mapping ROI index to brain region are provided in S1 Text.

