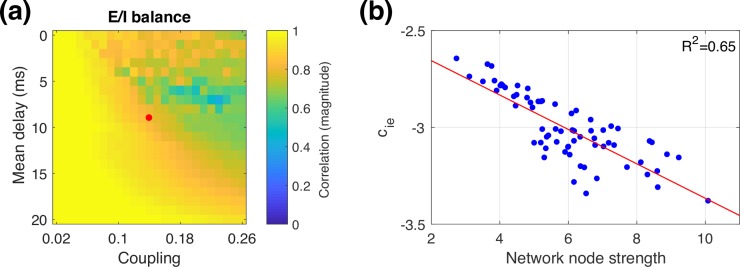
Fig 7. Balance of excitation and inhibition.
(a) Magnitude of correlation between node strength and cie for a range of global couplings and delays. The red dot corresponds to the parameters shown in Fig 5. (b) cie values plotted against network node strength, for the parameters marked in panel (a) by the red dot, with a linear fit (red line).

