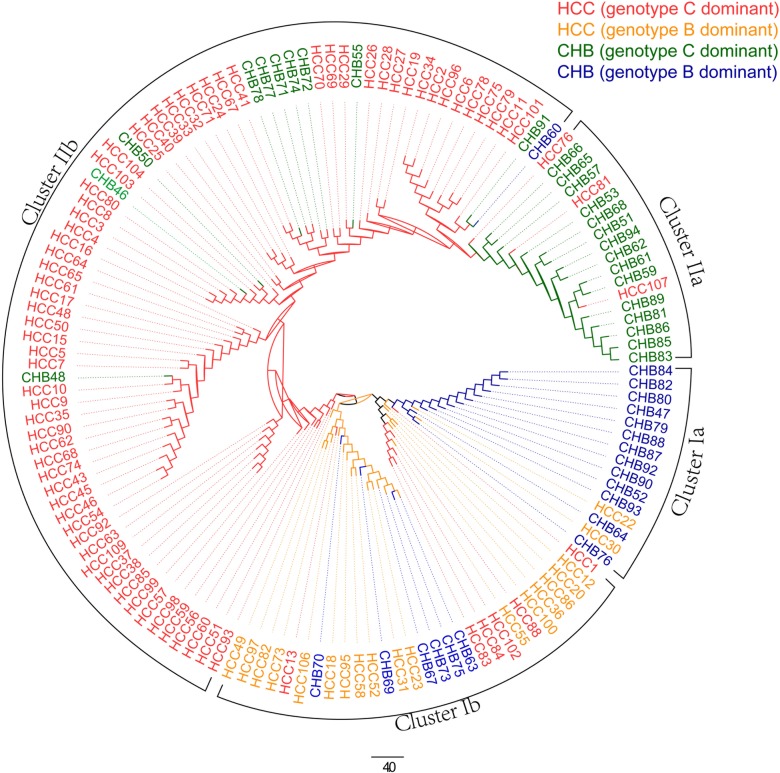
Fig 3. Hierarchical clustering results of samples HCC and CHB from the first data set.
There are four different colors of branches: red means HCC samples genotype C dominant, yellow means HCC samples genotype B dominant, green means CHB samples genotype C dominant, blue means CHB samples genotype B dominant. One genotype dominant means the fraction of this genotype is the highest among all genotypes.

