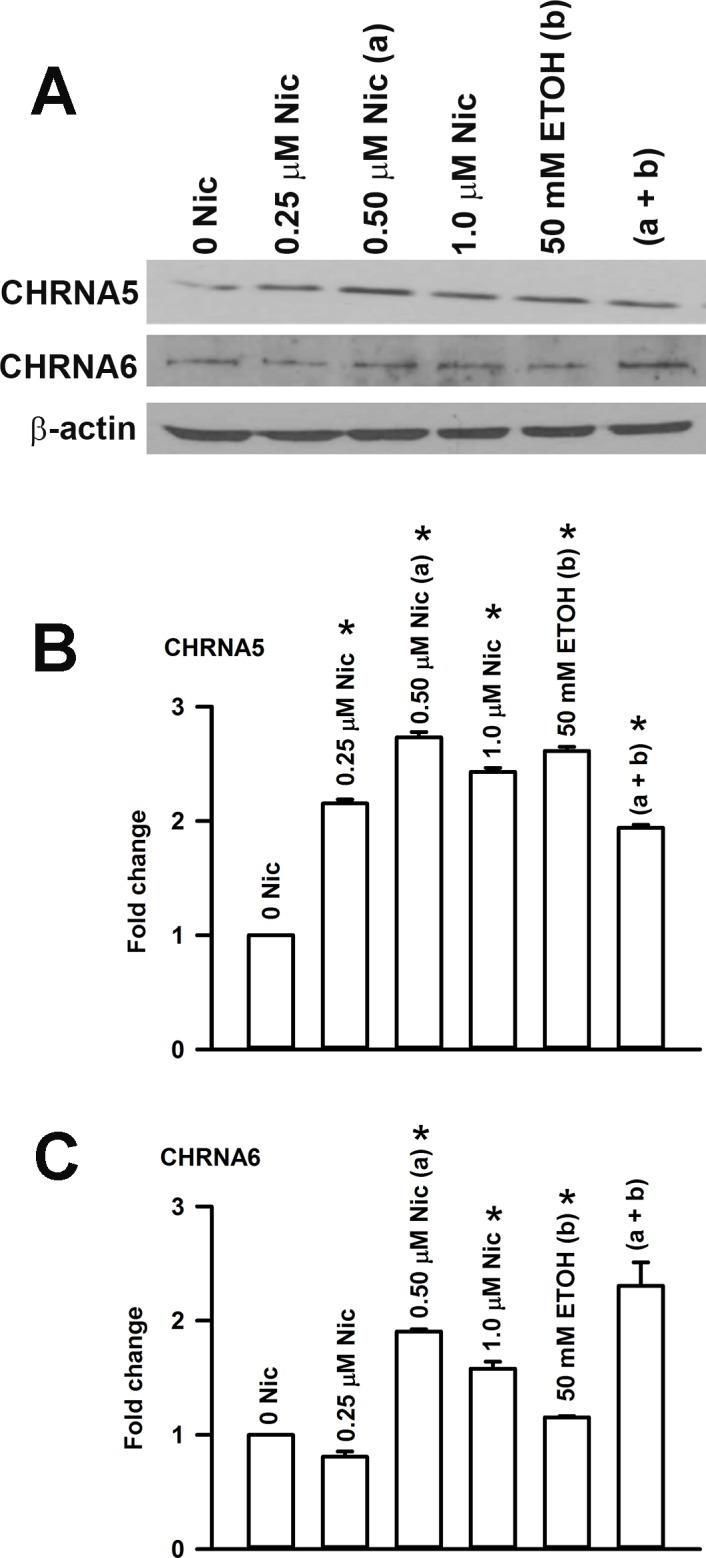
Fig 14. Effect of Nic exposure on the CHRN subunit mRNA expression level in HBO cells.

(A) After 24h Nic treatment. Relative to control, at 0.25 μM Nic the *p values for CHRNA3, CHRNA5, CHRNA6, CHRNB2, and CHRNB4 mRNAs were 0.0111, 0.0306, 0.0017, 0.0239, and 0.0173, respectively. Relative to control, at 0.50 μM Nic the *p values for CHRNA3, CHRNA5, CHRNA6, CHRNB2, and CHRNB4 mRNAs were 0.0022, 0.0473, 0.0014, 0.0049, and 0.0141, respectively. Relative to control, at 1.0 μM Nic the *p values for CHRNA3, CHRNA5, CHRNA6, CHRNB2, and CHRNB4 mRNAs were 0.0194, 0.0055, 0.0013, 0.0236, and 0.0003, respectively. Relative to 0.25 μM Nic, at 0.50 μM Nic the *p values for CHRNA6 and CHRNB4 were 0.0039 and 0.0024. Relative to 0.50 μM Nic at 1.0 μM Nic the *p values for CHRNA6, CHRNB2, and CHRNB4 were 0.0192, 0.0144, and 0.0046, respectively. (B) After 24h ETOH treatment. Relative to control, at 50 mM ETOH the *p values for CHRNA3, CHRNA5, CHRNA6, and CHRNB2 mRNAs were 0.0048, 0.0207, 0.0020, and 0.0169, respectively. Relative to 50 mM ETOH, at 50 mM ETOH + 0.5 μM Nic the *p values for CHRNA3 and CHRNA6 mRNAs were 0.0049 and 0.0024. (C) After 4 days treatment. Relative to control, at 0.25 μM Nic the *p values for chrna6 and CHRNA7 mRNAs were 0.0003 and 0.024, respectively. After 4 days treatment, relative to control, at 0.50 μM Nic the *p values for CHRNA5, CHRNA6, CHRNA7, and CHRNB4 were 0.0402, 0.0001, 0.0049, and 0.0001, respectively. Relative to control, at 1.0 μM Nic, the *p values for CHRNA5, CHRNA6, CHRNA7, and CHRNB4 were 0.0009, 0.0005, 0.0001, and 0.0001, respectively. The values represent mean ± SEM of triplicate measurements.
