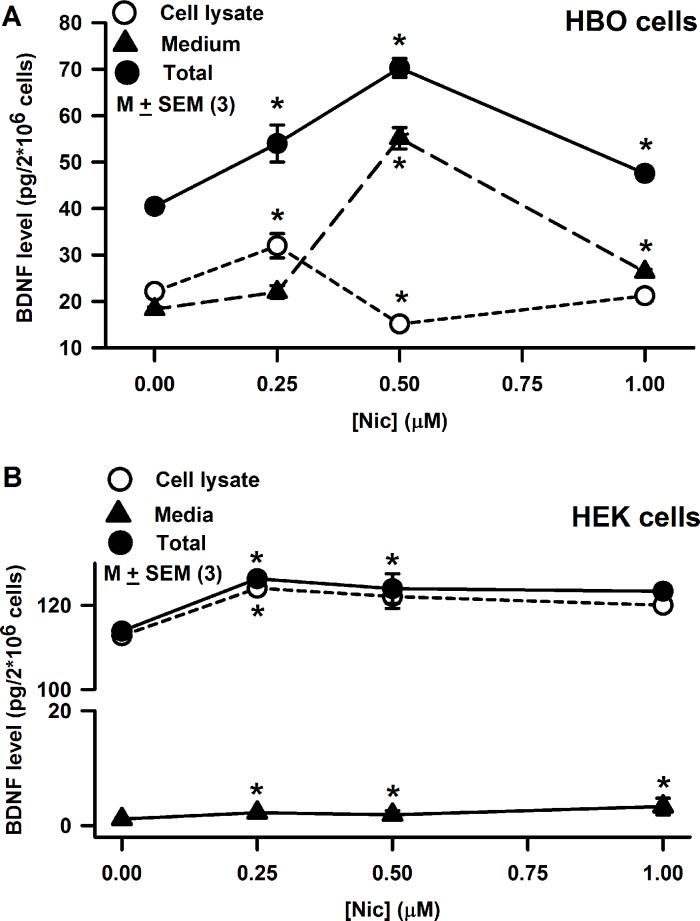
Fig 15. Effect of Nic on BDNF synthesis and release in HBO cells and HEK293 cells.
(A) HBO cells were treated with 0.25, 0.50, and 1.0 μM Nic for 30 min. Following that BDNF concentration was measured in cell lysate and the media. Relative to control BDNF concentration in cell lysate increased at 0.25 μM Nic (p = 0.0274) and decreased at 0.5 μM Nic (p = 0.0055). No significant increase in BDNF concentration was observed at 0.25 μM Nic, however, at 0.5 μM Nic, BDNF concentration was significantly increased relative to control (p = 0.0001). Relative to control at 1.0 μM Nic, a small but significant increase in the BDNF concentration was observed in the media (p = 0.0004). The p values for the changes in total BDNF content for 0.25, 0.5 and 1.0 μM Nic were 0.0289, 0.0002, and 0.0014, respectively. The values are mean ± SEM of triplicate measurements. (B) In HEK293 cells, BDNF concentration in cell lysate was about 6 times greater than in HBO cells. Relative to control, at 0.25 μM Nic, BDNF concentration in cell lysate was significantly increased (p = 0.0001), and remained elevated at 0.5 μM (p = 0.0331) and 1.0 μM Nic (p = 0.0041). Relative to control at 0.25 μM, 0.5 μM, and 1.0 μM Nic, a small but significant increase in the BDNF concentration was observed in the media (p = 0.0001). The values are mean ± SEM of triplicate measurements.

