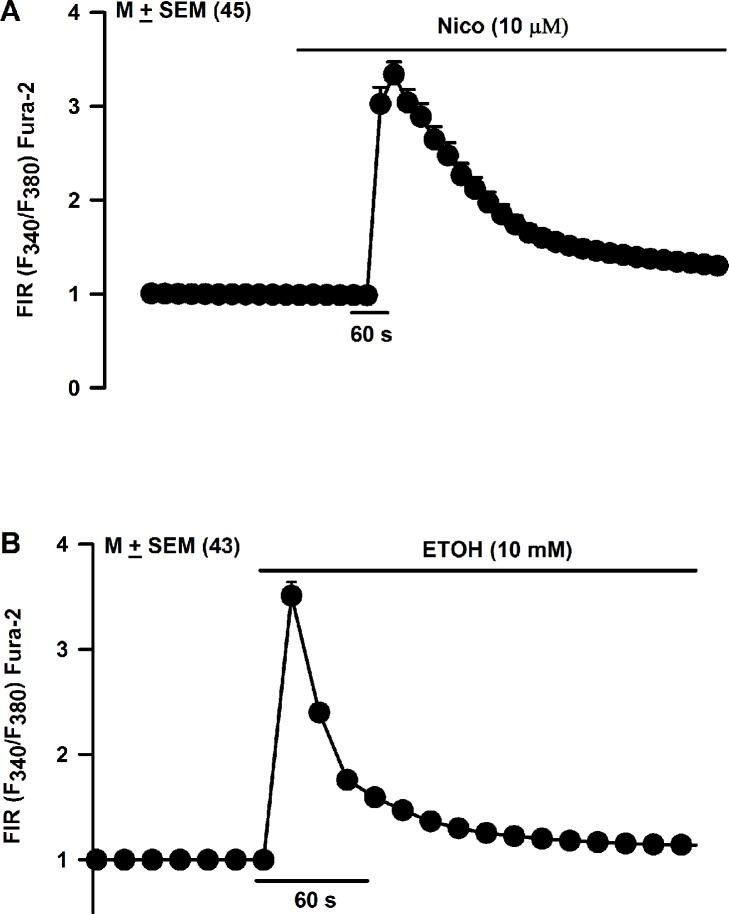
Fig 18. Effect of Nic and ETOH on temporal changes in [Ca2+]i in individual HEK293 cells.
(A) Shows changes in FIR in all 45 HEK293 cells in the visual field that were stimulated with 0.01 mM Nic. In each cell, the FIR was normalized to 1 with respect to its value under the control conditions. The values are mean ± SEM of the number of cells in the visual field. (B) Shows changes in FIR in all 43 HEK293 cells in the visual field that were stimulated with 10 mM ETOH. In each cell, the FIR was normalized to 1 with respect to its value under the control conditions. The values are mean ± SEM of the number of cells in the visual field.

