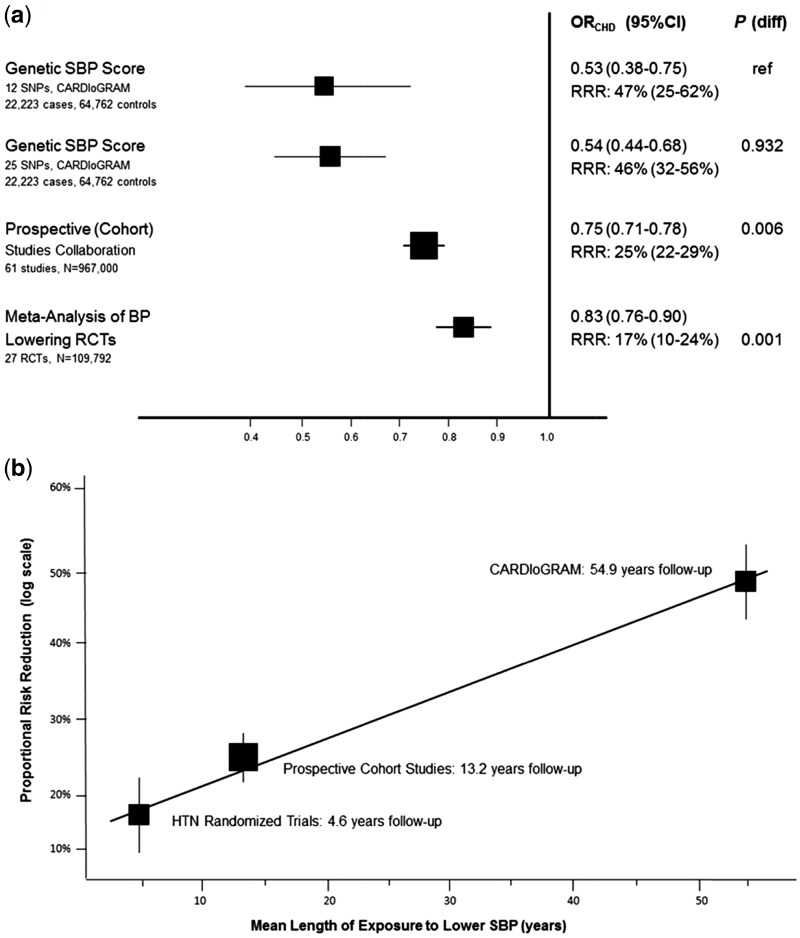
Figure 2.
Triangulation of effect of systolic blood pressure on CHD risk from three approaches (RCT, multivariable regression and MR). Both graphs show the effect of exposure to 10 mmHg lower systolic blood pressure (SBP) on risk of coronary heart disease (CHD). In (a), squares represent the effect estimate for the association between 10 mmHg lower systolic blood pressure (SBP) and the risk of CHD; horizontal lines represent 95% confidence intervals (CI). The relative risk ratios (RRR) and their 95% CI are given for each approach on the righthand side of the graph. The P-values to the right of the RRR values (P diff) are testing the null hypothesis that results from the different approaches and are consistent with results from the first MR study (reference study). In (b), squares represent the proportional risk reduction (1−risk ratio) of CHD per 10 mmHg lower SBP plotted against the estimated mean length of exposure to 10 mmHg lower SBP; vertical lines represent 1 standard error (SE) above and below the point estimate of proportional risk reduction. Results are plotted against the estimated duration of exposure to lower SBP for each approach. Reproduced from reference 53 with permission.

