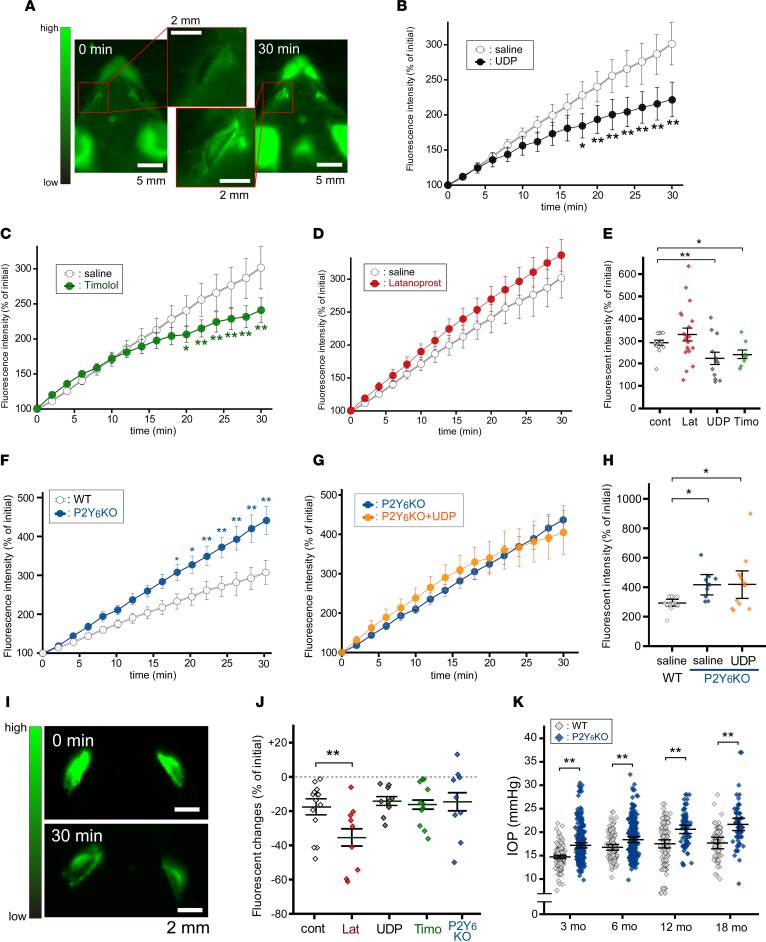
Figure 3. Aqueous humor dynamics.
(A) Fluorophotometry model A (Fph-A). I.p.-injected fluorescein concentrated in the anterior chamber. (B–D) Time courses of fluorescent changes in the anterior chamber. (B) UDP and (C) timolol reduced the fluorescein influx rate, but (D) latanoprost did not (n = 10–21, **P < 0.01 vs. control, 2-way repeated ANOVA followed by Fisher’s LSD test). (E) Quantitative data for fluorescence intensity at 30 minutes (n = 10–21, *P < 0.05, **P < 0.01 vs. control, 1-way ANOVA followed by Fisher’s LSD test). (F) P2Y6KO mice showed enhanced fluorescein influx, and (G) no UDP effects were observed. (H) Quantitative data at 30 minutes of F and G (n = 10–16, *P < 0.05 vs. control, 1-way ANOVA followed by Fisher’s LSD test). (I) Representative images of latanoprost-treated eyes in the Fph-B model. Significant reduction in fluorescence intensity was observed at 30 minutes. (J) Fluorescein draining was significantly enhanced by latanoprost but not by UDP or timolol, or in P2Y6KO mice (n = 10–18, **P < 0.01 vs. control, 1-way ANOVA followed by Bonferroni correction). (K) IOP levels were significantly higher compared with those of WT mice (n = 61–318, **P < 0.01, Bonferroni correction). Data are shown as means ± SEM. Scale bars: 2 (A, inserts, and I) and 5 mm (A).

