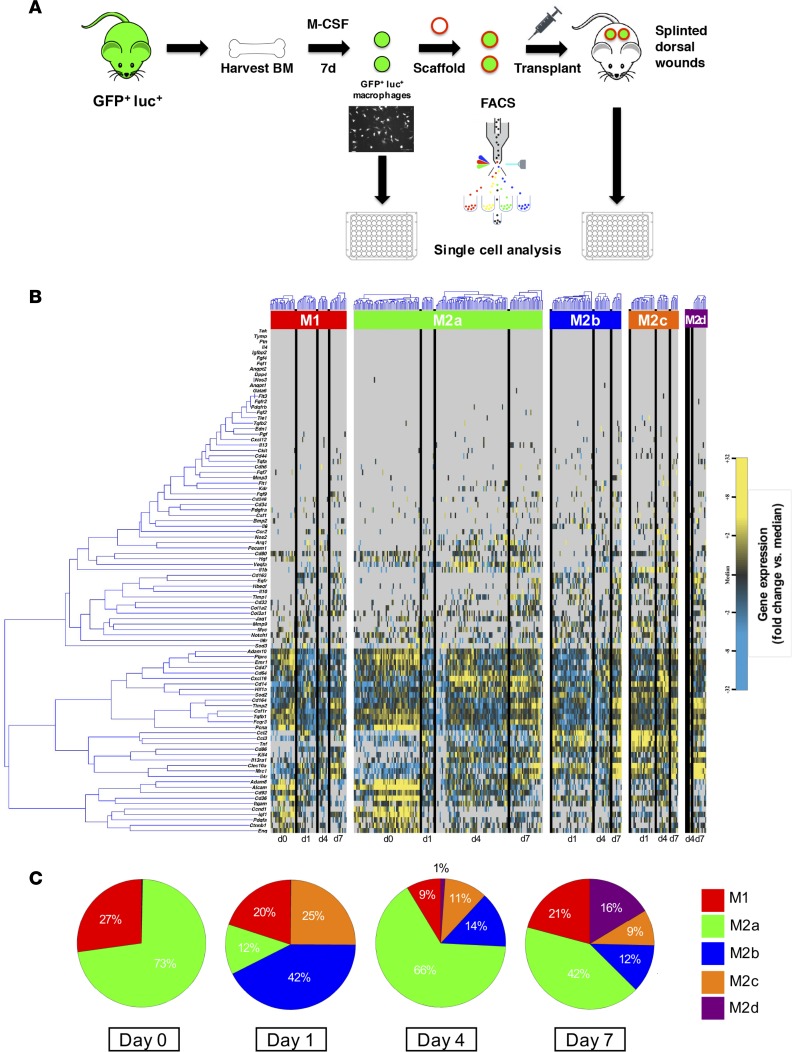
Figure 2. Macrophage differentiation following transplantation.
(A) Schematic detailing the macrophage harvest, transplantation, and FACS isolation. (B) Hierarchical clustering of macrophages from day 0 (directly from culture) and days 1, 4, and 7 after seeding onto hydrogel and transplantation onto wounds based on macrophage phenotype (M1, M2a, M2b, M2c, and M2d). Gene expression is presented as fold change from median on a color scale from yellow (high expression, 32-fold above median) to blue (low expression, 32-fold below median), with gray indicating no expression. (C) Pie chart of macrophage phenotypes, as determined by hierarchical clustering of cells from day 0 (directly from culture) and days 1, 4, and 7 after seeding onto hydrogel and transplantation onto wounds.

