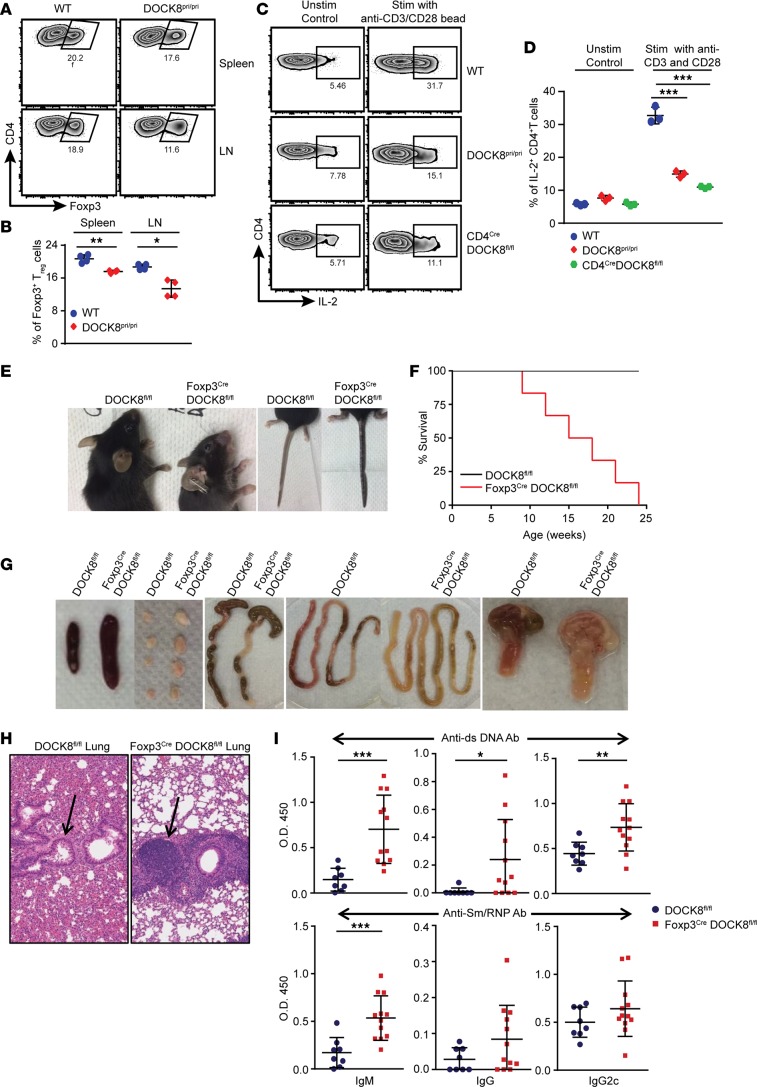
Figure 1. Treg-specific deletion of DOCK8 causes autoimmunity.
(A and B) Flow plot and graph showing the frequency of Tregs in the spleen and LNs of WT and DOCK8-deficient mice. Data represents 2 experiments with 4 mice per group. (C and D) DOCK8-deficient T cells have intrinsic defect in IL-2 production in response to TCR stimulation. WT, DOCK8pri/pri, and CD4CreDOCK8fl/fl animal LN cells were stimulated with anti-CD3 and anti-CD28 for 24 hours, followed by 4-hour stimulation in the presence of PMA and Ionomycine and then intracellular cytokine staining for IL-2. Data represents 3 experiments with 3 mice per group. (E) Representative image of small mouse size, crusting of tail, and skin lesions that develop around ears of 8-week-old Foxp3CreDOCK8fl/fl mice compared with control (DOCK8fl/fl) mice. (F) Percent survival and (G) Representative images showing splenomegaly (first from left), lymphadenopathy (second from left), and inflammation in small intestine (third and fourth from left) and stomach (fifth from left) in 8-week-old Foxp3CreDOCK8fl/fl mice compared with control mice. (H) Representative section of lung stained with H&E depicting higher lymphocytic infiltration (pointed by arrow) in 8-week-old Foxp3CreDOCK8fl/fl mice in comparison with DOCK8fl/fl mice; ×20 magnification. (I) Elevated levels of anti–dsDNA IgM, IgG, and IgG2c (upper panel), and anti-Sm/RNP IgM, with a trend toward increased anti-Sm/RNP IgG and IgG2c Ab (lower panel) in Foxp3CreDOCK8fl/fl mice compared with age-matched controls. Data represent 5–12 mice per group. These data shown are the mean ± SD. Statistics were performed with Prism software by using t test (B and I) and 1-way ANOVA (D). *P < 0.05, **P < 0.01, ***P < 0.001.

