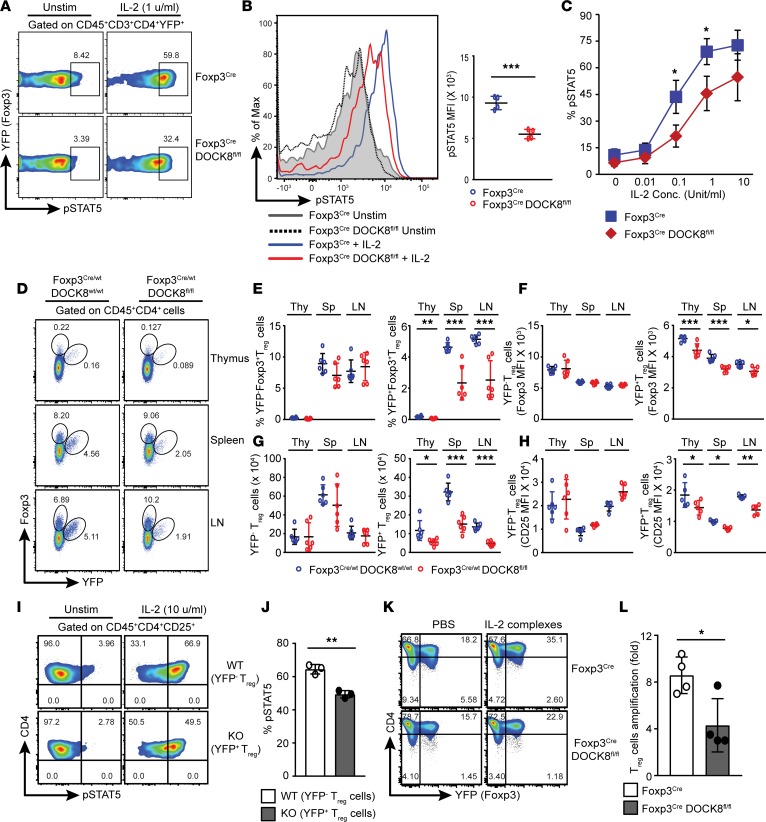
Figure 5. Tregs require DOCK8 for optimal STAT5 activation and competitive fitness.
(A–C) Combined cells from spleen and LN were stimulated with indicated concentration of IL-2 for 15 minutes, and then cells were analyzed for pSTAT5 by flow cytometry. (A) FACS plot showing the pSTAT5, (B) histogram showing the mean fluorescent intensity (MFI) of pSTAT5, and (C) dose response analysis of pSTAT5 in response to IL-2 stimulation in CD45+CD4+YFP+ Tregs isolated from control or Foxp3CreDOCK8fl/fl mice. Results described in this figure are representative of 3 independent experiments with minimum of 2–3 mice per group. (D–H) DOCK8-deficient Tregs are defective in competitive fitness in the presence of WT Tregs. (D) Representative FACS plots showing the frequency of Tregs (CD45+CD4+Foxp3+) in thymus, spleen, and LN of Foxp3Cre/wt DOCK8wt/wt and Foxp3Cre/WT DOCK8fl/fl female mice. (E and G) The frequency (E) and absolute number (G) of Foxp3+YFP– Tregs (E, left panel) and Foxp3+YFP+ Tregs (E, right panel) in indicated organs. (F and H) Plot showing the MFI of Foxp3 (F) and CD25 (H) in thymus, spleen, and LN of Foxp3Cre/wt DOCK8wt/wt and Foxp3Cre/WT DOCK8fl/fl female mice. Data represents at least 3 independent experiments with 4–6 mice per group. (I and J) Combined cells from spleen and LN of female Foxp3Cre/WT DOCK8fl/fl mice were stimulated with 10 unit/ml of IL-2 for 15 minutes, and then cells were analyzed for pSTAT5 by flow cytometry. (I) FACS plot and (J) histogram showing the frequency of pSTAT5+ cells in response to IL-2 stimulation in CD45+CD4+CD25+YFP– (WT) and CD45+CD4+CD25+YFP+ (KO) Tregs. Results described in these figures are representative of 3 independent experiments with 3 mice per group. (K) Representative FACS plot showing the frequency of Tregs in the spleen of control and Foxp3CreDOCK8fl/fl mice after PBS or IL-2 complexes injections. (L) Histogram showing the proliferation of sorted Tregs from control and Foxp3CreDOCK8fl/fl mice after 12 days of culture in the presence of IL-2– and CD3/D28–coated beads. The data shown are the mean ± SD. Statistics were performed with Prism software by using t test. *P < 0.05, **P < 0.01,***P < 0.001.

