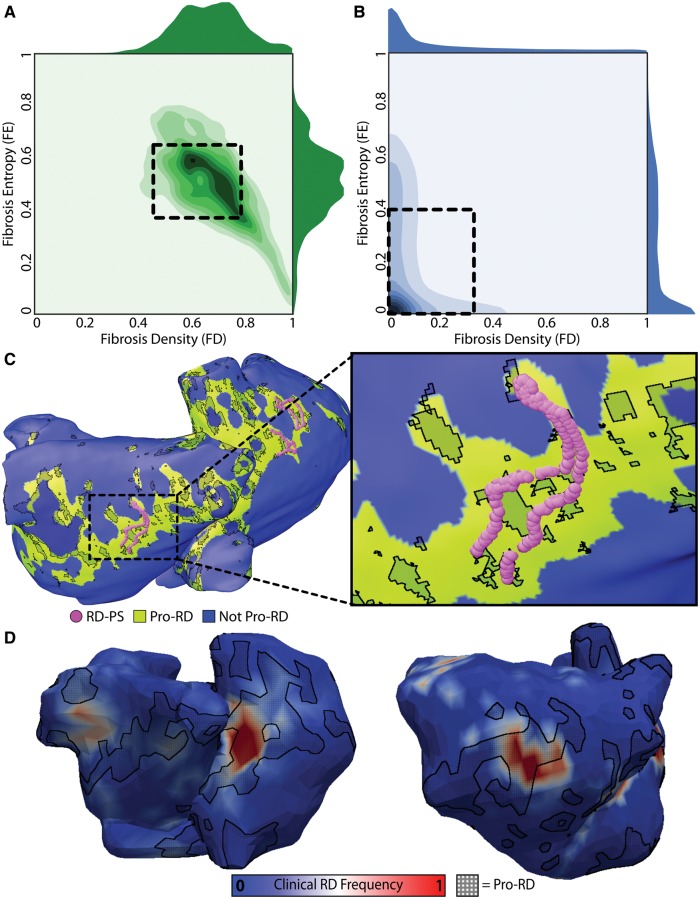
Figure 4.
Quantitative characteristics of fibrosis spatial pattern in atrial regions that harbour reentrant drivers of persistent AF. (A) 2D histogram showing the values of fibrosis density and entropy (FD and FE) metrics at locations of phase singularities associated with reentrant drivers induced by rapid pacing in 13 patient-specific models. 1D histograms of FD (above) and FE (right) values are also shown. Boxed region: values within one standard deviation of mean FD and FE values (0.37 ≤ FE ≤ 0.65; 0.46 ≤ FD ≤ 0.80). (B) Same as (A) but for locations where phase singularities were never observed. Boxed region: 0 ≤ FE ≤ 0.40; 0 ≤ FD ≤ 0.32. (C) Locations of all reentrant driver-associated phase singularities for a particular patient-derived atrial model overlaid on map showing distribution of tissue regions with the fibrosis spatial pattern identified by machine learning (see text) as favourable to the initiation and perpetuation of reentrant arrhythmia (green). (D) Maps of reentrant driver-associated phase singularity frequency obtained via ECGI during persistent AF episodes in two patients. Regions classified as favourable to reentrant driver localization by machine learning (i.e., same as green regions in (C)) are overlaid with a black crosshatched pattern. With permission from Zahid et al.44

